If you’re a veteran in this space, you probably understand the many incident response metrics and concepts, along with the many (at times exasperating) acronyms. For those new to the space, or even those with years of experience, the terminology is often overwhelming.
If you’re one of those people who’s struggling to navigate through the world of DevOps metrics, we’ve created this article for you. In this post, we’ll cover four main incident response metrics: MTTA, MTTR, MTBF, and MTTF. Learn what these acronyms mean, how you can use them, and how you can tie these KPIs into your Netdata experience.
When it comes to measuring performance metrics in the DevOps universe, tracking failure KPIs is critical for reliable incident response. Teams can use this data to perform root cause analysis to resolve issues and better prepare for future incidents. This article will also cover how to use Netdata for calculating these metrics for faster incident response times and better troubleshooting.
MTTA
Mean time to acknowledge, or MTTA, is a measurement of how quickly a team begins to respond to an incident. MTTA is a calculation for the length it takes for the actual response to begin. Tracking MTTA is critical for improving effective incident analysis and triaging. Teams that are equipped with this data are enabled to minimize the time required to analyze alerts as they occur and determine priority levels for resolving incidents.
MTTR
MTTR is an acronym for mean time to recovery; many also replace recovery (although all have the same meaning) with resolution, restore, or repair. MTTR is the necessary amount of time needed to repair and restore a system that is experiencing an incident to its fully functioning state. The calculation begins when the repairing starts and continues on until the team restores all operations. The measurement may include the repair time, Q/A testing period, and the recovery to normal operating conditions.
MTBF
MTBF is a term that stands for mean time between failures. MTBF calculates the predicted time that passes between one previous failure of a system to the next failure. This measurement helps you forecast how long a service can run before the next unknown incident occurs. The acknowledgment that failure within systems and applications will occur at some point, regardless of your tech stack, is a fundamental component of MTBF.While MTTR calculates recovery, MTBF calculates the predicted elapsed time between two failures for a system. The higher the measurement of MTBF, the longer a system will be likely to return to full operation before failing.
MTTF
Mean time to failure, known as MTTF, is a method of measuring the reliability of non-repairable systems. It’s similar to MTBF, but used in the DevOps world for assets that a team can’t repair like they would a faulty database server, such as tape drives or hard drives. The calculation represents the expected length of time until an operation fails. The value is measured by assessing incidents for a particular asset over a period of time and calculating the average time before failure.
Using incident response metrics with Netdata
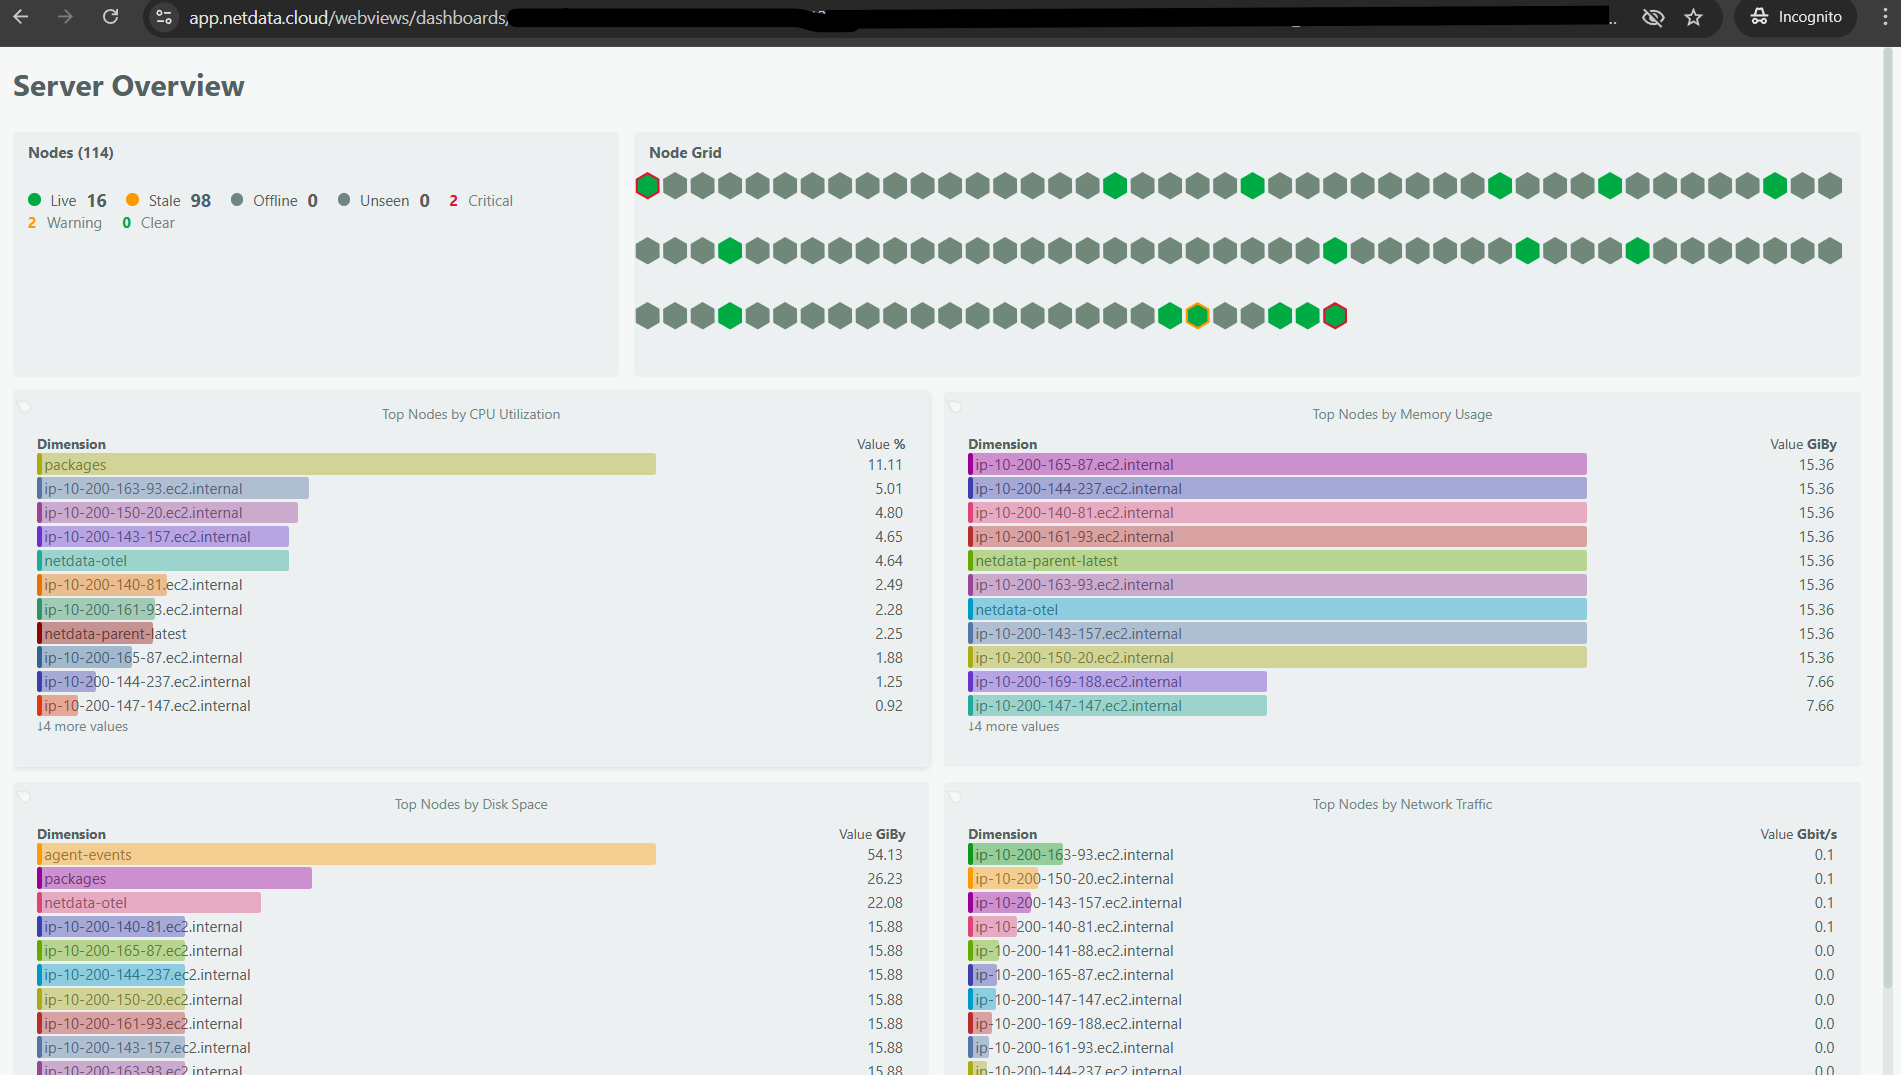
Netdata provides users the ability to collect thousands of metrics for monitoring and troubleshooting, playing the lead role in your detection, mitigation, and root cause analysis processes. Netdata helps with DevOps metrics by giving teams the visibility to see when, down to the exact second, a failure started or a recovery took hold. Once an incident begins, Netdata’s rich visualizations help teams do proper root cause analysis to resolve problems faster or perform proactive maintenance to prevent failures before they occur.Each of the incident response metrics covered in this post are methods you and your team can incorporate into your troubleshooting workflows with Netdata itself. Using Netdata’s preconfigured dashboards and alarms, along with our database engine for storing historical data, you can to track back the amount of time taken to recover from an incident (MTTR), in addition to the time between outages or incidents (MTBF), the amount of time your team took to respond to an incident (MTTA), and lastly, the mean time to failure of a particular incident (MTTF).
Netdata’s features, most of which work out-of-the-box or have minimal configuration, let you and your team spend time on monitoring anomalies or resolving incidents rather than configuring and deploying tooling or platforms. A few of these features include:
Advanced alerting
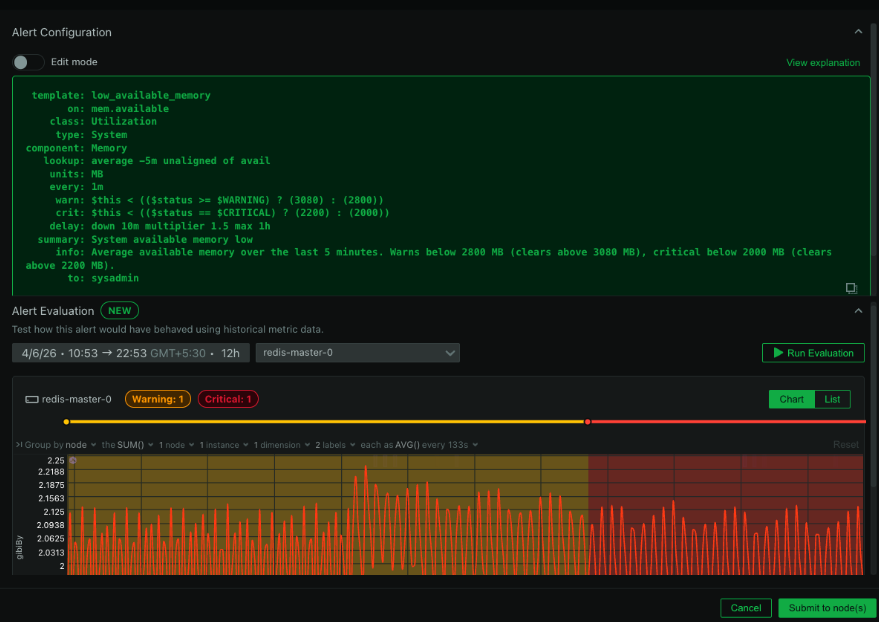
Netdata comes with pre-configured alarms and plenty of options for you to customize your own. Once enabled, get centralized alarm notifications via email from Netdata Cloud, or point individual nodes to more than two dozen endpoints. These alarms provide a critically important way for DevOps and SRE teams to view relevant charts to view real-time and historical metrics for understanding the cause of an incident. Active alarms to enable you to drill down into the details, compare impacted services to other running nodes, and assist in root cause analysis.Metric Correlations
Netdata offers plenty of other features where your team can use incident response practices for troubleshooting, including Metric Correlations, which provides insights by viewing all the dimensions available to see what has changed in a significant way in comparison to a baseline window. This works to streamline your MTTR by reducing overhead of manual processes.300+ collectors
When Netdata starts, and with zero configuration, it automatically detects thousands of data sources and immediately collects per-second metrics. Netdata can immediately collect metrics from these endpoints for over 300+ collectors, all that come pre-installed when you install the Netdata Agent.As we continue developing new collectors to improve incident response times, you can begin to optimize your troubleshooting workflows. New tools like our Anomalies collector, which uses machine learning (ML) models to identify which metrics are deviating from a “normal” baseline, help your team use inventive new troubleshooting techniques to efficiently resolve issues and improve infrastructure health and performance.
Automated remediation
In our recent blog post, we cover how the integration between Netdata and StackPulse drives down MTTD and MTTR with health alarms, troubleshooting data, and automated remediation. Netdata and StackPulse work in parallel to help SREs and DevOps teams troubleshoot new issues with Netdata’s per-second metrics, then standardize how they remediate issues in StackPulse. This automatically resolves known issues, to move faster on new anomalies, helping drive down MTTD and MTTR.Although there are an abundance of methods and terminology related to incident response, the key to driving down incident management time to resolution is helping teams collaborate with the information they need at hand to troubleshoot faster. We’ve designed Netdata for a straightforward approach to pursue a philosophy of continuous improvement.
If you’re ready to start incorporating incident response processes into your DevOps workflows check more on using Netdata for incident management.


