









Today we are excited to launch one of our flagship ML assisted troubleshooting features in Netdata – the Anomaly Advisor.
The Anomaly Advisor builds on earlier work to introduce unsupervised anomaly detection capabilities into the Netdata Agent from v1.32.0 onwards.
Getting Started
With ML running on your nodes (it is enabled by default), each node produces an “Anomaly Bit” every second in addition to raw metric values. This anomaly bit will be 1 when the trained ML models consider recent raw data for a metric to look anomalous or 0 when things look ’normal’. The Anomaly Advisor leverages this information to enable seamless space or room level anomaly detection out of the box with minimal configuration.
To get started with the Anomaly Advisor, check out the documentation or the walkthrough video provided in this section. Machine learning is enabled by default on Agents and Parents with persistent storage, so models start training as soon as the Agent runs; the [ml] section of your netdata.conf is only needed to change where models train, for example to offload training to a Parent. Detection starts on each metric after about 15 minutes of data.
Note: You can enable ML based anomaly detection on your nodes themselves or for each node on a parent it streams to. You can see come example topologies in the configuration documentation.
Monitoring Agents Don’t Need To Be Dumb!
This feature is part of a broader philosophy we have at Netdata when it comes to how we can leverage ML-based solutions to help augment and assist traditional troubleshooting flows, without having to centralize all your data. You can read more about this approach in our recent blog post which goes into more detail.
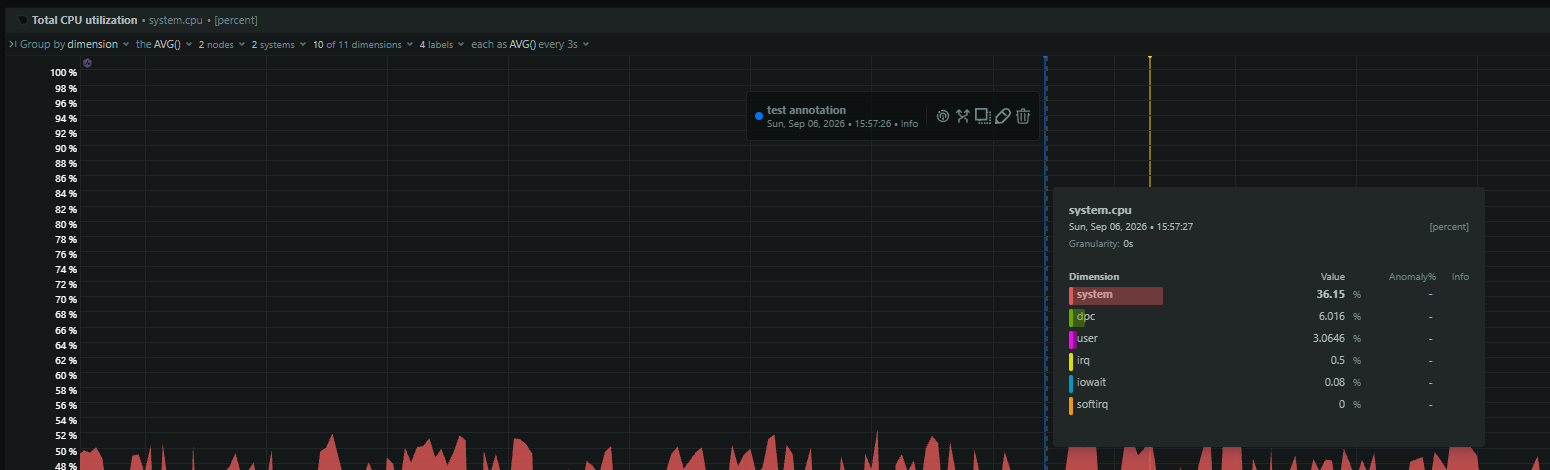
The new Anomalies tab quickly lets you find periods of time with elevated anomaly rates across all your nodes. Once you highlight a period of interest, Netdata will return a ranked list of the most anomalous metrics across all selected nodes in the highlighted timeframe. The goal here is to quickly let you find periods of strange activity in your infrastructure and surface what metrics Netdata considered most anomalous during that time.
Below is a quick video walkthrough of how to get started using the Anomaly Advisor. You can find more related videos on this playlist from our YouTube channel.
We love feedback!
We’d love to hear any and all feedback you have about this feature. We continually improve the ML under the hood in the agent and the overall UX experience as users share their thoughts with us.
If you would like to share feedback, email us at analytics-ml-team@netdata.cloud, comment on the launch post in the Netdata community, or come join us in the 🤖-ml-powered-monitoring channel of the Netdata discord, or open a discussion in GitHub if that’s more your thing.
Learn more
If you’d like to dive deeper and learn a little more about exactly how it all works, please feel free to check out some of the resources below.
- Anomaly Advisor documentation.
- Netdata agent ML reference documentation.
- CNCF Live session with recording on YouTube (deck).
- Anomaly Advisor playlist on the Netdata YouTube channel.
- The code itself in the Netdata Agent GitHub repo, along with a Google Collab ready notebook based Python implementation to help those interested understand how it all works under the hood, the main concepts and some illustrated explanations.
- Yet another presentation that tries to explain the main concepts and moving parts.