We’ve been thinking a lot about synthesis lately.
Netdata already samples every metric every second at the edge. Engineers told us the remaining pain point was synthesis, the ability to pull hours or days or months of high‑resolution time‑series into a concise explanation they could hand to a teammate (or use themselves to debug faster).
You know the pattern. An incident happens, and suddenly you’re context-switching between dozens of dashboards, trying to reconstruct a timeline. Or you need to write a capacity planning report, and you’re copy-pasting screenshots into slides, manually correlating trends across different retention windows. The raw data is there, but the synthesis step (the part where you turn metrics into narrative) doesn’t scale.
Manual post-processing scripts worked for a few nodes, but they broke down at scale. We needed something that could consume the full resolution of our edge-stored data and compress it into the kind of analysis you’d hand to a teammate.
Netdata Insights is how we solved this.
The goal is true infrastructure intelligence. Taking the complete picture that Netdata already knows about your infrastructure and turning it into the kind of analysis that scales human decision-making.

What We Built
Insights currently delivers structured reports across four core areas - and you can customize:
Capacity Planning Trend projections with inflection-point dates. No more guessing when you’ll hit resource limits.
Performance Optimization Synthesized analysis of contention patterns, throttling risks, and concrete remediation steps.
Infrastructure Summary Perfect for Monday morning context reconstruction. What happened over the weekend? Which services were affected? What needs attention?
Anomaly Analysis Context-aware detection and explanation of unusual patterns in your infrastructure behavior.
Each report combines natural-language explanations, relevant visualizations, and actionable recommendations, all generated on-demand.

Real Examples
Weekend Incident Recovery You return Monday morning to find scattered alert notifications. Generate an infrastructure summary for the past week, and within minutes you have a complete timeline: which services were affected, what the root cause was, and what still needs attention.
Quarterly Capacity Planning Your platform team needs to justify next quarter’s infrastructure budget. Generate a capacity planning report that synthesizes current utilization trends, projects future bottlenecks, and provides concrete hardware recommendations ready to share with finance.
Performance Debugging An SRE investigating Kubernetes performance issues gets more than CPU graphs: synthesized analysis of container throttling patterns, resource contention signals, and prioritized remediation steps.

How It Works
The architecture is straightforward: the insights service runs on Netdata cloud and interfaces between your existing Netdata agents (data layer) and a large language model (intelligence layer), handling the compression and context-building (processing layer) that makes synthesis possible.
Data Pipeline Your Netdata agents continue collecting metrics every second, storing them locally as they always have. When you request a report, Insights queries the relevant time ranges across your infrastructure, pulling raw metrics, events, and anomaly detection results.
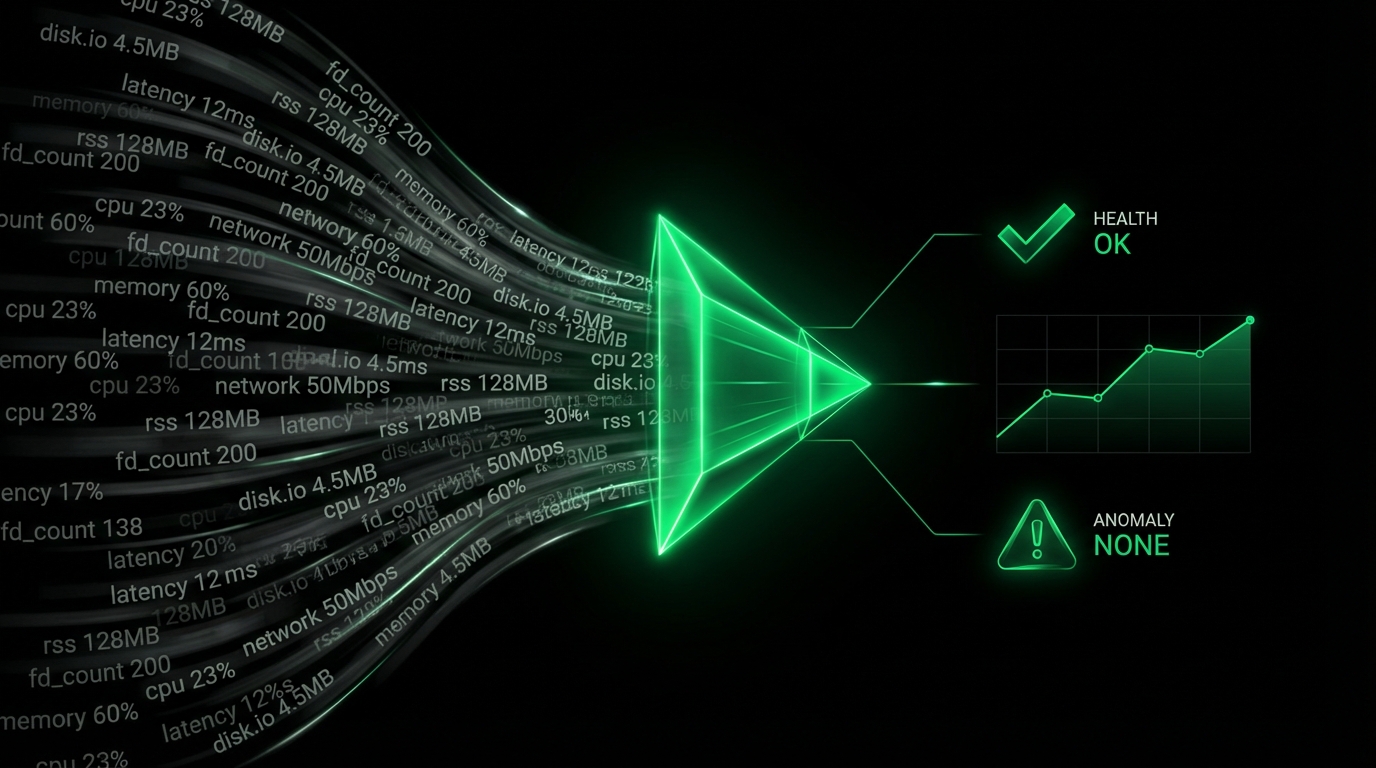
Context Compression This is where it gets interesting. We can’t just dump gigabytes of time-series data into a language model, the context windows aren’t big enough and cost would be prohibitive, not to mention the signal-to-noise ratio would be terrible. Instead, we compress your data into a structured context bundle:
- Statistical summaries (percentiles, trends, correlation coefficients)
- Detected anomalies with their confidence scores and affected metrics
- Event timelines (alerts, deployments, configuration changes)
- Cross-node correlations and dependency mappings
- Historical baselines for comparison
Model Integration We’re currently using the latest Claude models from Anthropic, hosted on AWS Bedrock, but our philosophy is multi-model support. Different types of analysis benefit from different model architectures, and we want to use the best tool for each job, agnostic of provider.
The model receives the compressed context bundle along with a structured prompt that defines the report type, output format, and analysis depth. It returns structured information that we render into the final report. Your infrastructure data is never used for training or improving the underlying language models, it’s processed for your reports and then discarded.
Report Generation Reports are rendered with embedded visualizations, are downloadable (as pdf summaries) and are shareable via email to your team mates. Report generation currently takes 2-3 minutes on average, cutting the time it takes to do this sort of deeply researched analysis from hours to less time than going to get a cup of coffee.
What’s Coming Next
We’re expanding in two directions: more packaged reports and open-ended investigations.
More Packaged Reports We’re adding specialized report types for more specific use cases: cost optimization recommendations, SLO compliance summaries, and change impact assessments.
Open-Ended Investigations Beyond structured reports, we’re building support for natural language queries. Ask “What happened to my Redis cluster yesterday?” or “Why is this Kubernetes node underperforming?” and get scoped, contextual answers drawn from your actual telemetry data.
Full Agent Experience The end goal is full agentic AI capability in Netdata Cloud. An intelligent system that can autonomously investigate alerts, incidents, correlate problems across your infrastructure, and even connect to external tools (GitHub, Jira, Slack) for holistic incident management.
We’re not interested in building another chatbot. We want to build an autonomous debugging partner.
Getting Started
Netdata Insights is currently in beta as a research preview, available in Netdata Cloud for Business users and everyone on the Free Trial. It works with any infrastructure where you’ve deployed Netdata agents - no additional configuration, no new pipelines to maintain.
Everyone gets 10 reports to generate for free, and we’re working on bundled packages for teams that need higher volumes. Community users who want early access can reach out to us on Discord or email us at [email protected]
The core insight here is simple: we already collect all the data you need for these analyses. Insights just makes that data useful at human timescales.
Try it today in Netdata Cloud →
_We’re at an interesting inflection point in infrastructure observability. For years, we’ve optimized for data collection - higher resolution, more metrics, better agents. Now we can start optimizing for human understanding. When your monitoring system can not only detect problems but explain them in context, troubleshooting shifts from art to engineering.
This is the beginning of what we think observability becomes when infrastructure intelligence scales as well as data collection. More to come._
