


Teams of all types use Netdata to monitor the health of their nodes with preconfigured alarms and real-time interactive visualizations, and when incidents happen, they troubleshoot issues with thousands of per-second metrics on Netdata Cloud. But based on the complexity of the team and the infrastructure they monitor, some parts of their incident management, such as pre-planned communication and escalation processes, or even automated remediation, need to happen outside of the Netdata ecosystem.
To help these teams drive down mean time to detection (MTTD) and mean time to resolution (MTTR) with health and troubleshooting data, Netdata integrates with dozens of external platforms. For the most part, this means sending alarm notifications to another application, which can then parse the alert data and enable new functionality.
The newest of these integrations is with StackPulse, a reliability platform that helps SREs and developers standardize and automate incident response and management. StackPulse enriches incoming alerts to give responders the full context needed for triage and analysis. By adopting an incident response “as code” approach, StackPulse gives teams the ability to deploy structured playbooks to execute their remediation process and incident communication. These playbooks can run fully automated, or be interactive, requiring team approval before performing sensitive tasks. This combination of enriched alert data and operational insight turns StackPulse into a single pane of glass for teams looking to understand incident details and response patterns.
With Netdata and StackPulse working in parallel, SREs and developers troubleshoot new issues with Netdata’s per-second metrics and support for hundreds of applications, then standardize how they remediate issues in StackPulse. They automatically resolve known issues, move faster and smarter on new anomalies, and continuously drive down MTTD and MTTR.
How Netdata and StackPulse work together
Because both Netdata and StackPulse are highly configurable, teams can change how they behave independently and interact with one another. Let’s walk through some possible incidents and how a team might respond to learn more.Automated rollback of faulty component deployment
Team A is responsible for maintaining a frontend web application written in Node.js. After the developers push a new release to production, Team A monitors the health of their infrastructure using the Netdata Cloud’s Overview dashboard. They notice an immediate uptick in CPU utilization across their infrastructure, then group composite charts by node to determine the culprit. They switch to the single-node dashboard for one of the nodes experiencing this CPU spike, and use the available metrics to determine that a Node.js application, in particular, is using 70% of the system’s available CPU.Team A notifies the developers, who manually roll back the release to perform some more bug fixing before trying again. They’ve saved the day, but now want to standardize and automate this troubleshooting and remediation process so that they don’t have to be on-call during every future component release. Team A starts by writing a new Netdata alert to send an alarm notification to StackPulse if a similar deployment incident happens again in the future.
template: node_cpu
on: apps.cpu
lookup: average -10s unaligned of node
units: %
every: 10s
warn: $this > 35
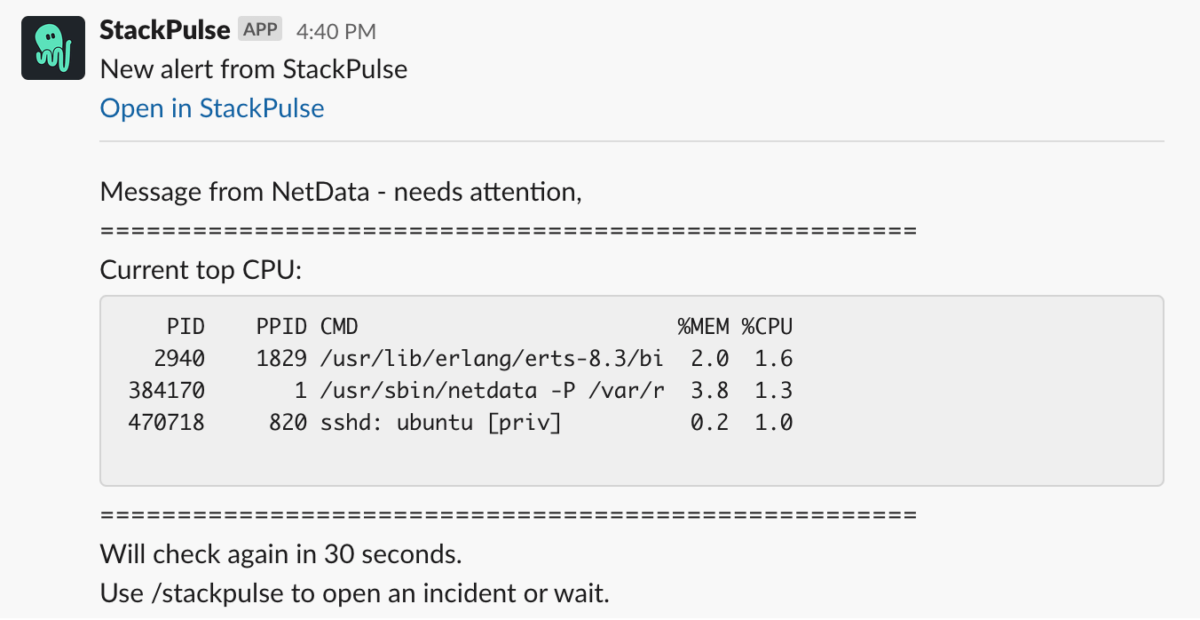
crit: $this > 50In the StackPulse platform, Team A now sees these alerts and can build playbooks around them. They build a new auto-remediation playbook based on this alert that pinpoints the recent deployment of the faulty application. StackPulse then automatically alerts the development team via Slack and asks for permission to perform an automated rollback. When the development team gives the OK, StackPulse rolls back the deployment, resolving the issue without any further intervention.
Vertical scaling of a restricted resource
Team B gets a Slack message from someone in marketing, who says that the corporate website is taking forever to load. At the same time, they receive the following alerts on Netdata Cloud from one of their nodes, running on Google Cloud Platform (GCP), which hosts the corporate site with Nginx.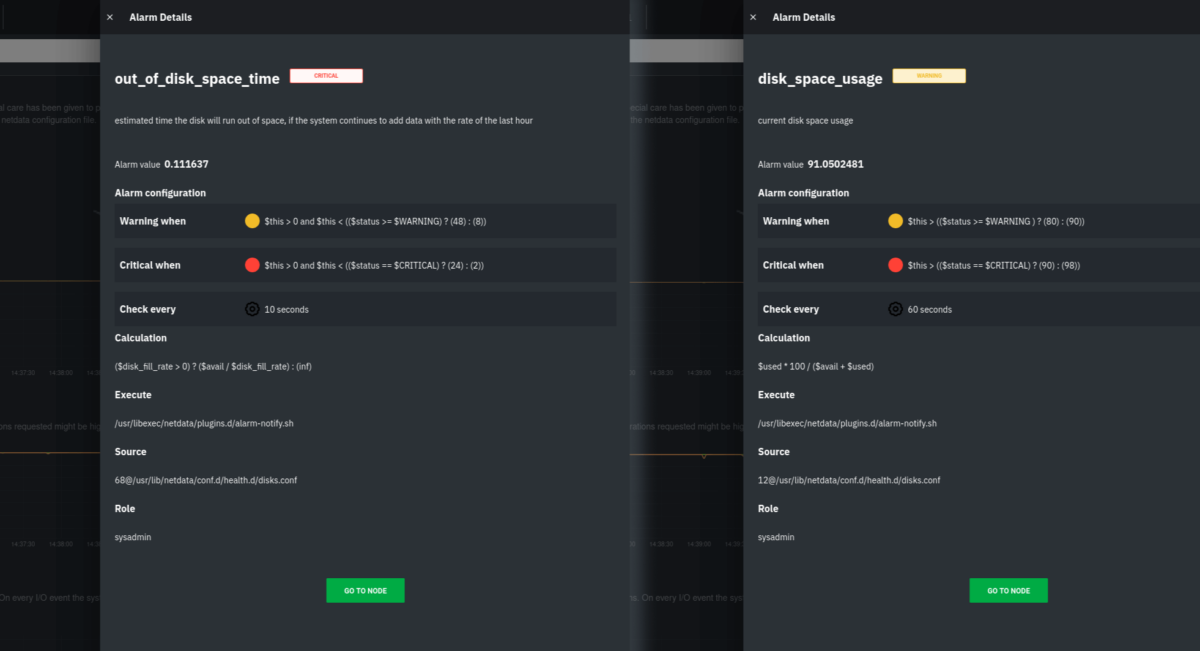
A composition of two disk-related alarms shown in Netdata Cloud
Clearly, the GCP virtual machine (VM) is critically low on disk space on the root partition and needs immediate intervention. Team B responds not by logging into GCP and vertically scaling the VM’s partition, but rather by quickly building a new playbook in StackPulse. Because Team B has already connected StackPulse to their organization’s GCP account, they can use the playbook capabilities to automatically create a new block storage device. Once StackPulse attaches this extra storage to the VM, Team B has solved the immediate low disk space issue. This buys them time to perform other root cause analysis, which leads them to the underlying issue.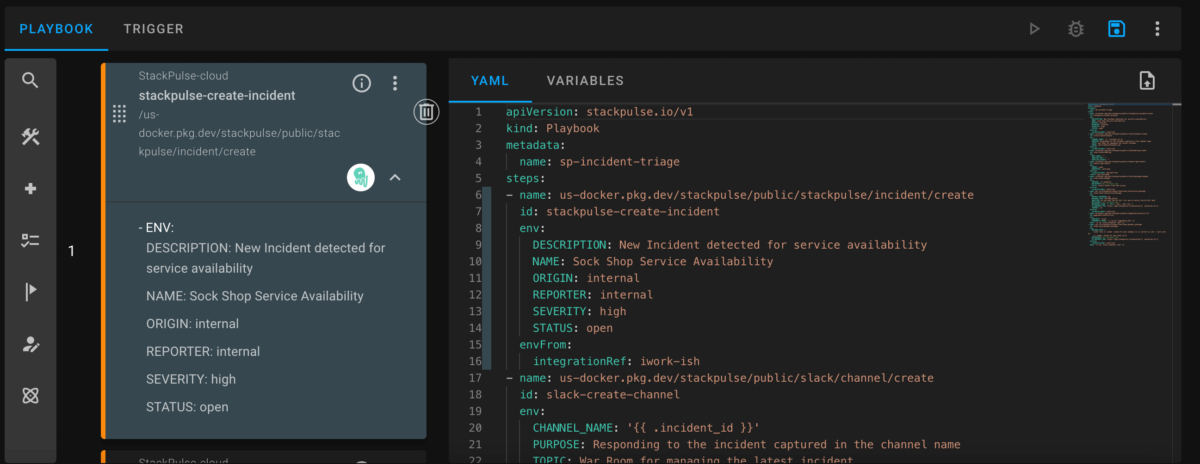
The incident management stakeholders on Team B build playbooks in code to standardize how the team responds and resolves the common disk space issue.
By automating reliability into their infrastructure, Team B can now focus more on proactive measures that would prevent this type of incident in the future while remaining confident their playbook will step in automatically if it happens again.Automatically opening incidents and orchestrating communications
Team C manages an infrastructure that uses Traefik to secure and route incoming connections to a variety of services running on other nodes within an Amazon Virtual Private Cloud (VPC). With Traefik as the centerpiece of their infrastructure, the team wants to be alerted whenever there’s a significant volume of non-successful responses. While this could include users receiving 404s for incorrect URIs, it could also signal routing issues or backend services that are not responding. They have a simple alarm that triggers anytime bad responses are received from Traefik.template: traefik_400s on: traefik.response_statuses lookup: sum -1m unaligned absolute of bad every: 10s warn: $this > 50 crit: $this > 100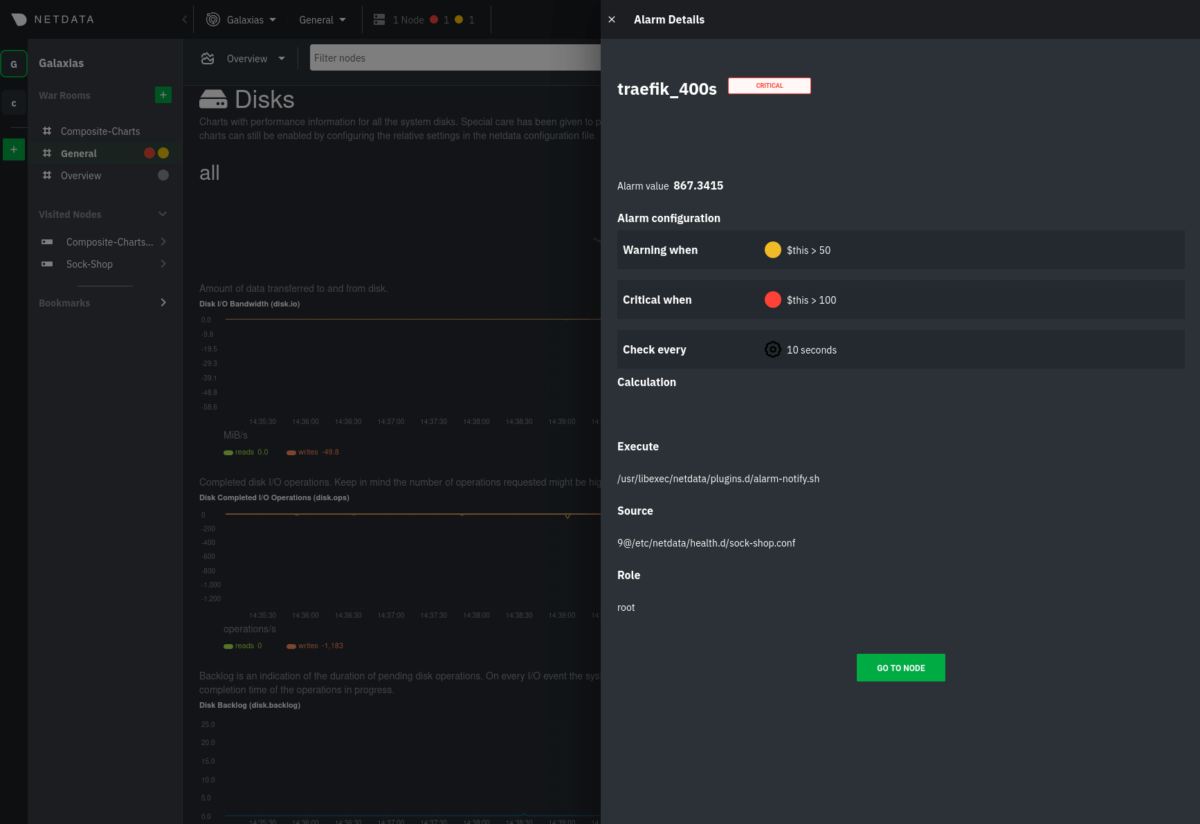
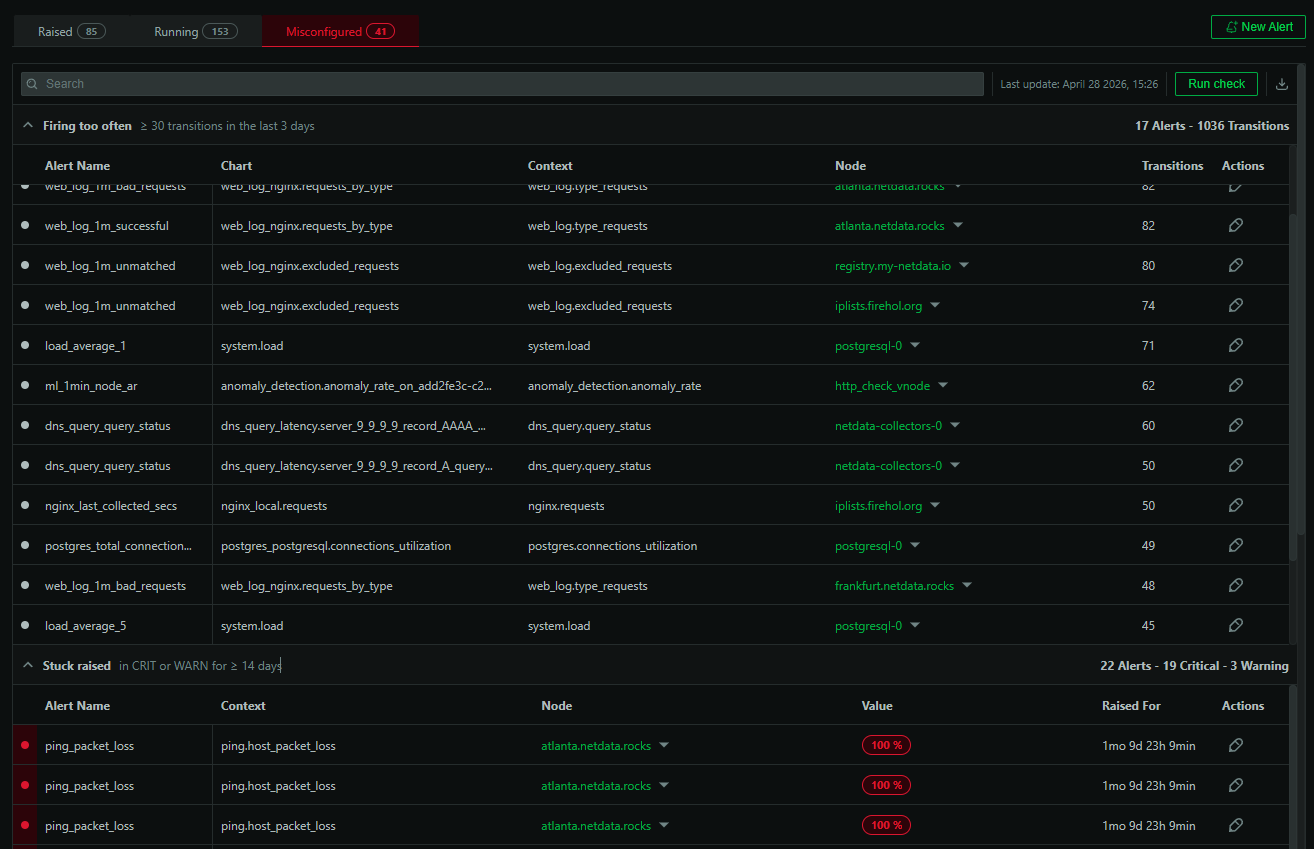
An alarm in Netdata Cloud showing that “bad” responses from Traefik have recently spiked to critical levels.
The good news is that Team C already developed a StackPulse playbook to speed response to these critical incidents that might require all hands on deck. The StackPulse playbook automatically creates a new incident and a Zoom call for everyone to join and discuss in real time. Next, StackPulse sends messages via Slack to engineering management with enriched environment details, and SMS messages to the on-call members of Team C to let them know they need to join the Zoom call. Finally, the playbook updates the organization’s status page to inform users about the ongoing issue and investigation. This happens automatically, freeing Team C to focus on the impact and remediation.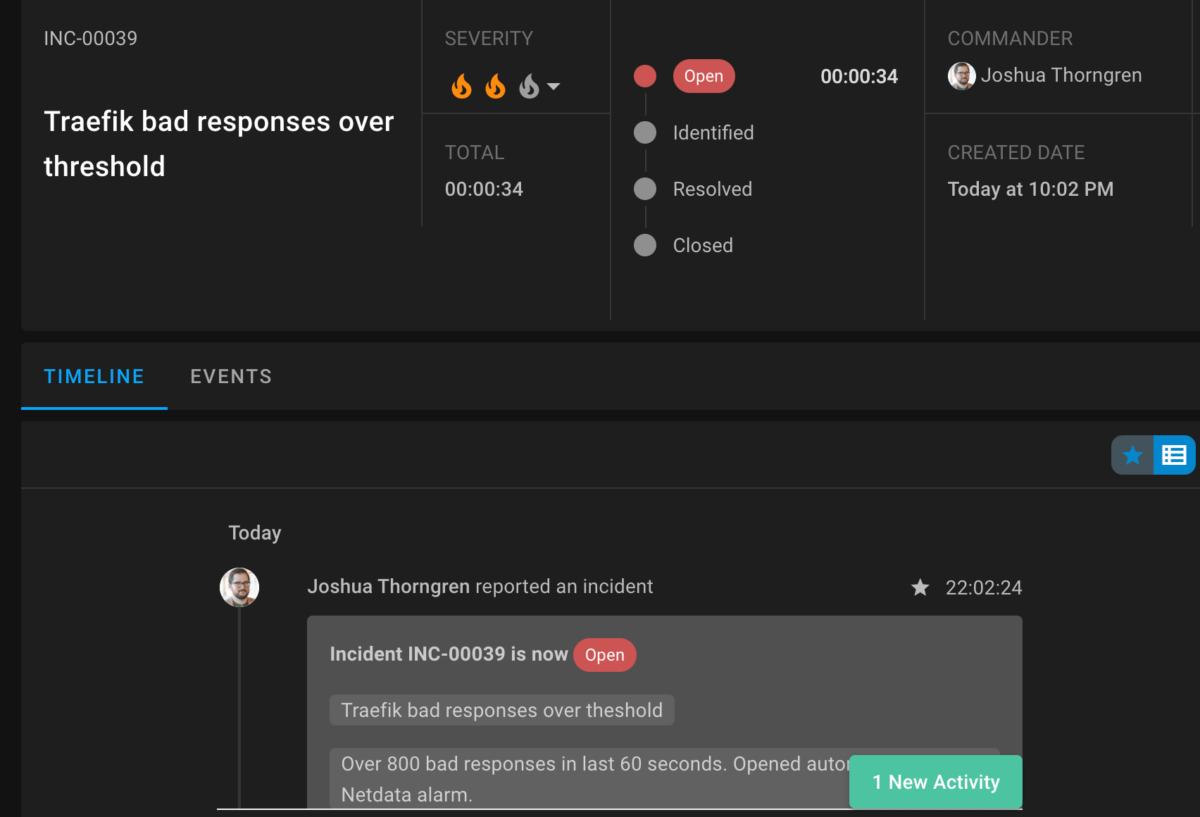
With an existing playbook in StackPulse, Team C already has raised a new incident with a commander, downtime, and enriched data.
What’s next?
By using Netdata and StackPulse in orchestration, teams of all sizes and skill levels make their incident management and remediation strategies easier and more reliable. They use hundreds of Netdata collectors to gather per-second metrics from every node, OS, and application on their infrastructure and perform complex performance troubleshooting across their infrastructure with Netdata Cloud. When they’ve identified opportunities for automation or easier remediation, they leverage StackPulse’s enrichment and playbook capabilities to reduce toil, centralize incident knowledge, and build more reliable services.To set up your own Netdata-StackPulse integration, sign up for Netdata Cloud and install the Netdata Agent on at least one node if you haven’t already. Next, sign up for a StackPulse trial. The StackPulse team will show you how StackPulse works and help you get started on their platform.
Once you’ve set up your monitoring and reliability platforms, read the StackPulse notification doc for instructions on sending alarm notifications to StackPulse through the API endpoint their platform creates for you. Once you’re sending alarm data to StackPulse, you can start using StackPulse playbooks to better manage incidents and improve reliability with the power of Netdata’s per-second metrics.