Netdata Agents and Parents now have a new UI!
Checkout the release meetup video or read on to learn more about the new UI and other features in this release.
- Netdata Growth
- Release Highlights
- Acknowledgements
- Contributions
- Collectors
- Documentation
- Packaging/Installation
- Health
- Exporting
- Other Notable Changes
- Deprecation notice
- Netdata Release Meetup
- Support options
Steady to our schedule, this is another great Netdata release!
Netdata Growth
- 64 k GitHub Stars ⭐
- 1.7 M monitored nodes
- 570+ M docker hub pulls
❤️ Thank you for your love! 🚀 You rock!
Release Highlights
New Agent Dashboard
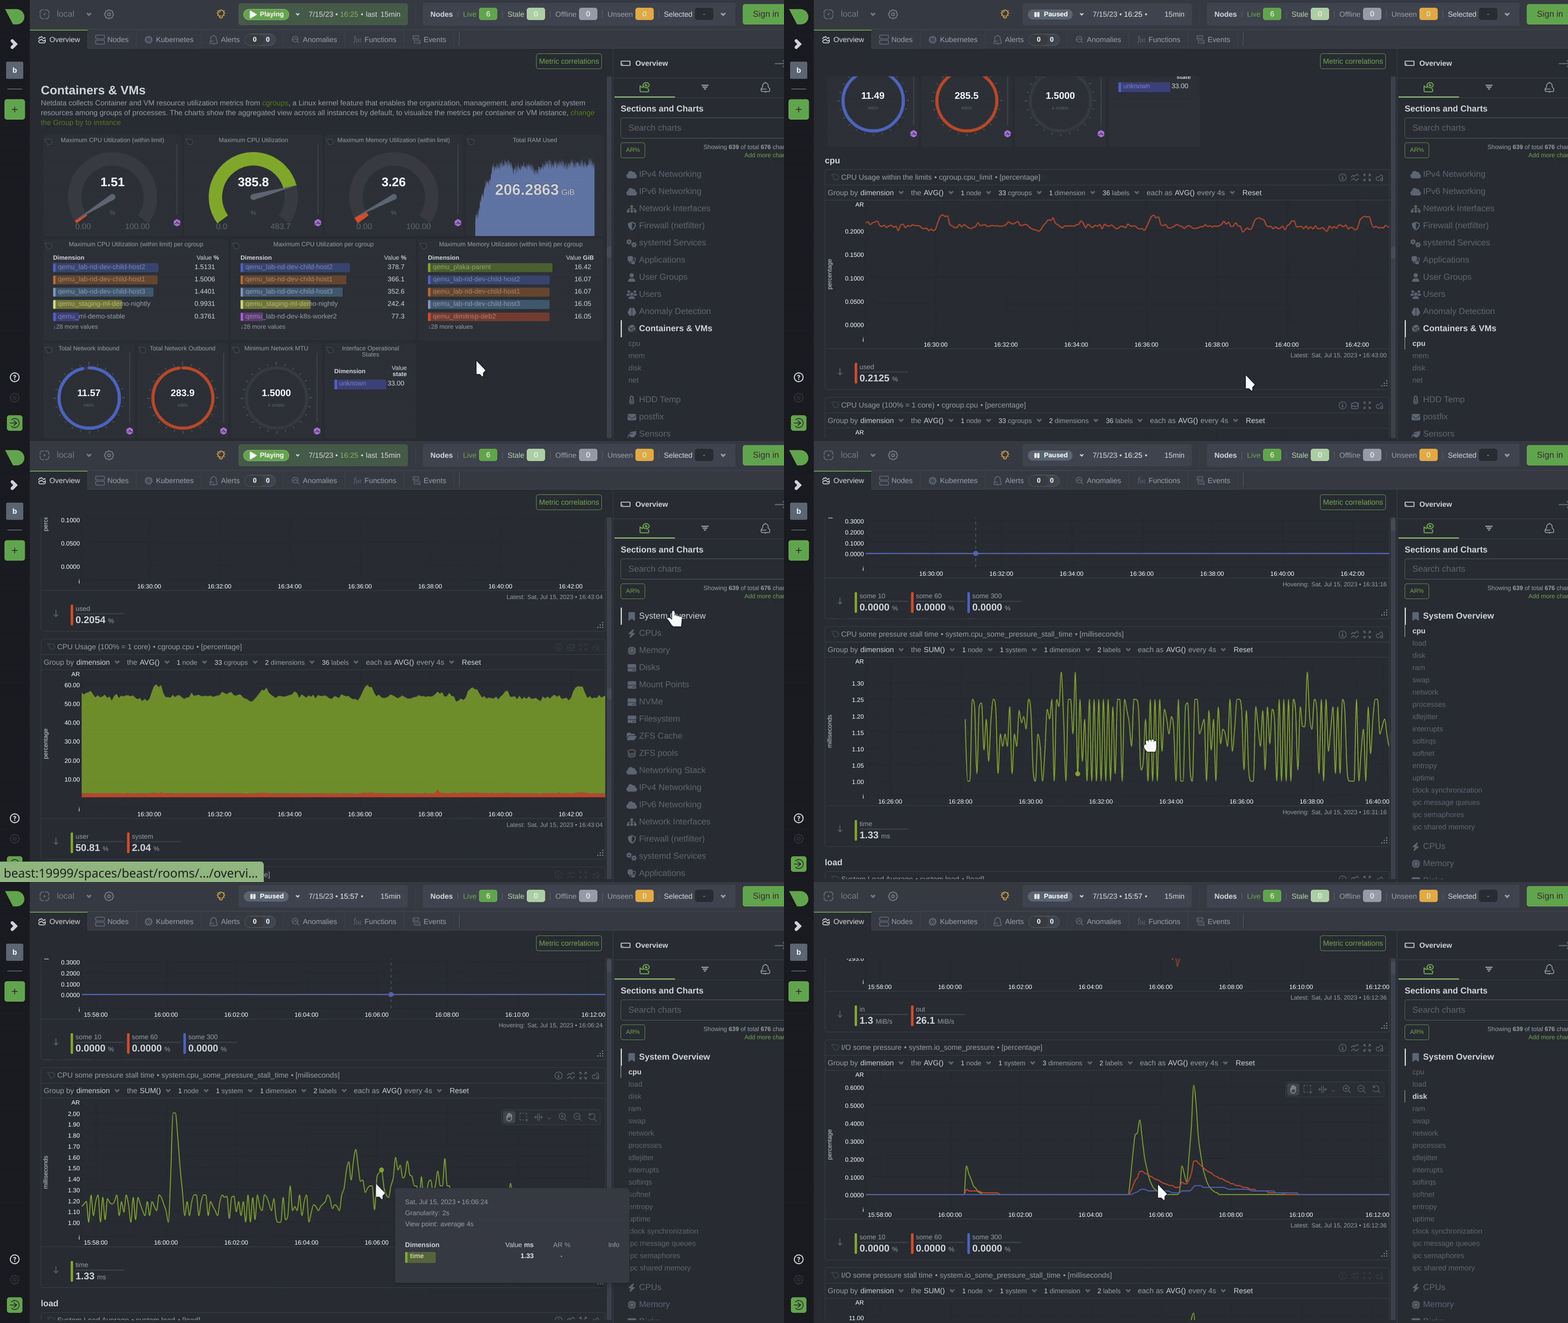
Netdata Agents and Parents now have a new UI!
New CHARTS 🟢 New SUMMARIES 🟢 MACHINE-LEARNING FIRST 🟢 INFRASTRUCTURE LEVEL DASHBOARDS 🟢 FILTER, SLICE, and DICE any dataset 🟢 ANOMALY ADVISOR 🟢 METRICS CORRELATIONS 🟢 NETDATA FUNCTIONS 🟢 EVENTS FEED 🟢 HEATMAPS 🟢
In the last few months, we have ported and open-sourced all Netdata Cloud APIs to the Netdata Agent, allowing Netdata Parents to drive the same multi-node / infrastructure level dashboards Netdata Cloud provides!
So, as of today, Netdata Agents and Parents present the same UI, exactly the same dashboard, charts and features with Netdata Cloud!
Single Node Dashboard Changes
Apart from the entirely new look, single-node dashboards now group similar charts together. So, all disk drives, network interfaces, cgroups (containers and VMs), are now a single set of charts.
This allows Netdata to aggregate a vast amount of datasets in a chart, like the following, where almost 20k containers are now manageable:
To make it easier for you to navigate, filter, slice, and dice the data, the menus above each chart give you easy access to all the data of the chart:
Multi Node Dashboards
When Netdata Agents are configured as Parents (multiple other agents stream metrics to them), they now present multi-node and multi-instance charts. At the top right corner of the dashboard, there is the global nodes filter, from which you can slice the entire dashboard for one or a few of your nodes.
Want to know more?
Get a firsthand walkthrough with Costa Tsaousis, Netdata’s Founder, on the rationale for this change and the path Netdata is taking by checking the video from Netdata Office Hours on YouTube.
The old dashboards are still accessible
You can still access all versions of the dashboards, as follows:
-
http://your.server:19999/The default dashboard is now a live version of the new UI. The dashboard static files are served by Cloudflare and are automatically updated when we release a new version of the UI, so that your Netdata agent is always up to date. -
http://your.server:19999/v2/A local copy of the latest dashboard, as it was at the time the agent was released. This is distributed with Netdata under the Netdata Cloud UI License v1.0. The local copy is automatically used if for any reason the web browser cannot download the live version of it. -
http://your.server:19999/v1/The previous single-node version of the Netdata Agent dashboard. -
http://your.server:19999/v0/The now ancient, original version of the Netdata Agent dashboard.
Netdata Assistant
Netdata Assistant: Your AI-Powered Troubleshooting Sidekick
The Netdata Assistant is an AI-powered tool that uses large language models and our community’s knowledge to guide you during troubleshooting and help you get to the root cause sooner.
The goal of the Netdata Assistant is straightforward: to make your troubleshooting process easier. It’s here to save you from the hassle of sifting through tons of information so you can focus on solving the problem at hand.
It will give you the lowdown on the alert, why it’s happening, and why you should care. It’ll also guide you on how to troubleshoot it and even offer some handy web links for more info if you’re interested.
Read more about it on the Netdata blog here.
New FreeIPMI collector for monitoring enterprise hardware
Netdata got a new FreeIPMI collector. The new collector is able to collect IPMI sensors at a much better data collection rate, and it is more reliable and robust compared to the previous one.
We have also categorized all sensors based on the component they monitor:
And provided as labels the exact sensor name each metric refers to:
Netdata Detects FDs Leaking
“FD” stands for “file descriptor”. A file descriptor is an integer that the operating system assigns to an open file to track it. This includes regular data files, directories, network sockets, pipes, and other types of I/O streams.
In Linux, everything is treated as a file, which includes hardware devices, directories, and sockets. Each open file is assigned a file descriptor. When a file is closed, its file descriptor is freed up for reuse. However, if an application doesn’t close a file when it’s done with it, that’s called a “file descriptor leak”.
File descriptor leaks can cause several problems:
-
Resource exhaustion: Each process has a limit to the number of file descriptors it can open. If a process continually leaks file descriptors without closing them, it will eventually hit this limit and won’t be able to open any more files, which often causes the process to crash.
-
Unexpected behavior: Open file descriptors hold resources, like network sockets, that might be expected to be available for other uses. If these resources are tied up due to a leak, it can cause unexpected behavior.
-
Security issues: File descriptors can sometimes be used to gain unauthorized access to data if they’re not properly managed.
apps.plugins is now able to track the usage of FDs against the limits set for each application. We have added an fds category in the Applications section of the dashboard. The first chart shows the percentage of FDs used by each application against its limits:
Acknowledgements
We would like to thank our dedicated, talented contributors that make up this amazing community. The time and expertise that you volunteer are essential to our success. We thank you and look forward to continuing to grow together to build a remarkable product.
- @k0ste for improving Prometheus exporting doc.
- @carlocab for replacing
infomacro with a less generic name. - @MYanello for updating the pfSense package installation instructions.
Contributions
Collectors
Improvements
- Improve of fds monitoring (apps.plugin) (#15437, @ktsaou)
- Add application groups file descriptor limit monitoring (apps.plugin) (#15417, @ktsaou)
- Re-create sdr cache on start (freeipmi.plugin) (#15361, @ktsaou)
- Add sensor state chart, create a per-sensor chart instead of a per-sensor dimension (freeipmi.plugin) (#15327, @ktsaou)
- Expose CmdLine in apps function (apps.plugin) (#15275, @ilyam8)
- Remove pod_uid and container_id labels in k8s (cgroups.plugin) (#15216, @ilyam8)
- Add cluster mode (go.d/elasticsearch) (#1227, @ilyam8)
- Add ‘fallback_type’ config option to match Untyped (go.d/prometheus) (#1225, @ilyam8)
Bug fixes
- Fix sensor state updates (freeipmi.plugin) (#15360, @ilyam8)
- Fix tc.plugin charts labels (tc.plugin) (#15262, @ilyam8)
- Fix collecting hostgroup from stats_mysql_connection_pool (go.d/proxysql) (#1226, @ilyam8)
Other
- Add eBPF Functions to enable/disable threads (ebpf.plugin) (#15214, @thiagoftsm)
- Hide eBPF functions (ebpf.plugin) (#15404, @thiagoftsm)
- Add profile.plugin (#13962, @vkalintiris)
Documentation
- Add link for netdata cloud and sign-in cta (#15431, @andrewm4894)
- Update Netdata logo in README.md (#15424, @christophidesp)
- Fix a typo in health.d/consul.conf (#15419, @Ancairon)
- Add reference to CNCF (#15408, @hugovalente-pm)
- Fix instructions on how to determine which installation method to use (#15351, @hugovalente-pm)
- Update the default Docker installation to provide the full feature set (#15339, @ilyam8)
- Fix swapped use of volume/bind mount in Docker readme (#15298, @Ancairon)
- Add Streaming and replication doc (#15297, @Ancairon)
- Update “health enabled by default” description in stream.conf (#15291, @ilyam8)
- Remove extra parenthesis from doc (#15290, @Ancairon)
- Merge spaces, war rooms and invite your team to one place (#15289, @hugovalente-pm)
- Fix mistype for ‘send automatic labels’ Prometheus option (#15282, @k0ste)
- Small readme improvements (#15270, @andrewm4894)
- Update pfsense.md package install instructions (#15250, @MYanello)
- Add RocketChat cloud integration docs (#15205, @car12o)
Packaging / Installation
- Update v2 dashboard to v6.21.3 (#15448, @ilyam8)
- Fix arch detection in static install update (#15396, @ilyam8)
- Add missing files to web/gui/Makefile.am. (#15383, @Ferroin)
- Build optimizations (#15381, @tkatsoulas)
- Update libbpf to v1.2.2 (#15373, @thiagoftsm)
- Update go.d.plugin to v0.54.0 (#15312, @ilyam8)
- Only try to enable _FORTIFY_SOURCE if the user has not disabled optimizations (#15284, @Ferroin)
- Assorted kickstart script improvements (#15243, @Ferroin)
- Fix file permissions under directory (#15208, @stelfrag)
- Add configuration file for netdata-updater.sh (#15149, @Ferroin)
- Add hardening options to CFLAGS by default if they are available (#15087, @Ferroin)
- Consistently start the agent as root and rely on it to drop privileges properly (#14890, @Ferroin)
- Add support for openSUSE tumbleweed (#14692, @tkatsoulas)
Health
- Removing some critical thresholds (#15124, @M4itee)
- Fix evaluating expression with
nan(#15348, @ilyam8) - Respect overriding nc binary for IRC notifications (#15310, @ilyam8)
- Keep health log history in seconds (#15314, @MrZammler)
- Fix windows alarms for virtual nodes (#15376, @ilyam8)
Exporting
- Hide not available for viewers charts when exporting in the shell format (#15309, @ilyam8)
- Fix slow exporting in Prometheus format (#15276, @ilyam8)
Other Notable Changes
Improvements
Bug fixes
- Fix unlocked registry access and add hostname to search response (#15426, @ktsaou)
- Fix interpreting encoded URLs (#15422, @MrZammler)
- Fix compilation on BSD (#15331, @thiagoftsm)
- Fix virtual hosts showing up as stale nodes (#15313, @ktsaou)
- Fix clean up of charts generated by external plugins (#15307, @stelfrag)
- Fix crash when opening Alarms Log tab on the parent instance (#15306, @MrZammler)
- Fix infinite loop in webserver (#15287, @ktsaou)
Code organization
- Add chart id and name to alert instances and transitions (#15430, @ktsaou)
- Use real-time clock for http response headers (#15421, @ktsaou)
- Pre release fixes (#15405, @ktsaou)
- Add expiration to bearer token response (#15392, @ktsaou)
- Fix CodeQL alert (#15384, @stelfrag)
- Update http response code descriptions (#15379, @ktsaou)
- Suppress H2O compilation warnings (#15378, @stelfrag)
- Fix coverity issues (#15375, @stelfrag)
- Dont log error on opening .environment (#15371, @ilyam8)
- Rename log_access and log_health (#15368, @MrZammler)
- Agent alert notifications redirect (#15350, @ktsaou)
- Bearer protection - additions (#15349, @ktsaou)
- Bearer improvements (#15342, @ktsaou)
- Add hostnames and items statistics to alerts_transitions outputs (#15329, @ktsaou)
- Use spinlock in host and chart (#15328, @stelfrag)
- Fix coverity issue 394862 - Argument cannot be negative (#15324, @stelfrag)
- Rename log Macros (debug) (#15322, @thiagoftsm)
- Bearer authorization API (#15321, @ktsaou)
- Fix not using host prefix in read_cmdline in read_cmdline() (#15320, @ilyam8)
- Update local-listener to use libnetdata (#15319, @ktsaou)
- Avoid memory allocations for alert transitions facets processing (#15318, @ktsaou)
- Add summary linking to alert instances (ati) when options=summary,values is requested (#15317, @ktsaou)
- Fix alerts transitions sorting (#15315, @ktsaou)
- Change info to netdata_log_info in sqlite_db_migration.c (#15303, @MrZammler)
- Change query to store host system info values (#15300, @MrZammler)
- Change info to netdata_log_info in profile.plugin (#15299, @vkalintiris)
- Rename generic
errorfunction (#15296, @thiagoftsm) - Optimizations part 3 (#15293, @ktsaou)
- Send alert chart labels config key to cloud (#15283, @MrZammler)
- Optimizations part 2 (#15280, @ktsaou)
- Misc alert fixes (#15274, @MrZammler)
- Replace
infomacro with a less generic name (#15266, @carlocab) - Rewrite /api/v2/alerts (#15257, @ktsaou)
- Use gperf for the pluginsd/streaming parser hashtable (#15251, @ktsaou)
- URL rewrite at the agent web server to support multiple dashboard versions (#15247, @ktsaou)
- Fix coverity 393183 & 393182 (#15234, @MrZammler)
- Create index for health log migration (#15233, @stelfrag)
- New alerts endpoint (#15232, @stelfrag)
- Various /api/v2 improvements (#15227, @ktsaou)
- Relax jnfv2 caching (#15224, @ktsaou)
- Fix /api/v2/contexts,nodes,nodes_instances,q before match (#15223, @ktsaou)
- Add recursive readers support to RW_SPINLOCK (#15217, @ktsaou)
- Allow overriding pipename from env (#15215, @vkalintiris)
- Memory reductions and optimizations (#15204, @ktsaou)
- Agent dashboard reorganization (#15200, @Ferroin)
- Add two functions that allow someone to start/stop ML (#15185, @vkalintiris)
- Add streaming function and various improvements to /api/v2/nodes (#15168, @ktsaou)
- Use a single health log table (#15157, @MrZammler)
- Redirect to index.html when a file is not found by web server (#15143, @MrZammler)
- Additional CO-RE code (eBPF.plugin) (#15078, @thiagoftsm)
Deprecation notice
There is not an obvious list of items that will be deprecated in the upcoming release (v1.42.0). Feel free to check and elaborate on the upcoming backlog
Deprecated in this release
In accordance with our previous deprecation notice, the following items in this release:
| Component | Type | Will be replaced by |
|---|---|---|
| python.d/nvidia_smi | collector | go.d/nvidia_smi |
family attribute |
alert configuration and Health API | chart labels attribute (more details on netdata#15030) |
Netdata Release Meetup
Join the Netdata team on the 21st of July at 17:00 UTC for the Netdata Release Meetup.
Together we’ll cover:
- Release Highlights.
- Acknowledgements.
- Q&A with the community.
RSVP now - we look forward to meeting you.
Support options
As we grow, we stay committed to providing the best support ever seen from an open-source solution. Should you encounter an issue with any of the changes made in this release or any feature in the Netdata Agent, feel free to contact us through one of the following channels:
- Netdata Learn: Find documentation, guides, and reference material for monitoring and troubleshooting your systems with Netdata.
- GitHub Issues: Make use of the Netdata repository to report bugs or open a new feature request.
- GitHub Discussions: Join the conversation around the Netdata development process and be a part of it.
- Community Forums: Visit the Community Forums and contribute to the collaborative knowledge base.
- Discord Server: Jump into the Netdata Discord and hang out with like-minded sysadmins, DevOps, SREs, and other troubleshooters. More than 1400 engineers are already using it!


