


The v1.25.0 release of the Netdata Agent delivers on our commitment to make our metrics collection, visualization, and troubleshooting platform more stable and usable. We enhanced our recently-added Prometheus collector with user-configurable filtering and grouping, made dramatic improvements to the reliability of the Agent-Cloud link that streams metrics on-demand to your browser when you use Netdata Cloud, and more.
Let’s jump in and look at each improvement.
Bringing meaningful metrics to our Prometheus collector
This release brings Netdata’s famous meaningful presentation layer to the Prometheus collector in the form of new filtering and grouping configuration options. These options let users more easily combine, organize, and choose exactly which charts they want displayed from metrics collected from a Prometheus endpoint.When we released the Prometheus collector in v1.24, it was only capable of visualizing every collected metric in a separate chart. While that might be useful if your only goal is to ingest per-second metrics from a Prometheus endpoint using Netdata, generic charts don’t add up to an experience optimized for troubleshooting complex performance issues.
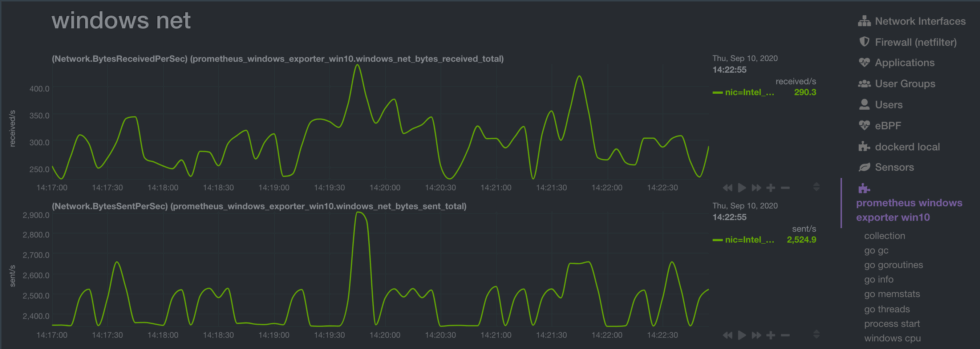
For example, here’s some raw Prometheus metrics for bytes received and sent on a Windows system:
# HELP windows_net_bytes_received_total (Network.BytesReceivedPerSec)
# TYPE windows_net_bytes_received_total counter
windows_net_bytes_received_total{nic="Intel_R__PRO_1000_MT_Desktop_Adapter"} 421794
# HELP windows_net_bytes_sent_total (Network.BytesSentPerSec)
# TYPE windows_net_bytes_sent_total counter
windows_net_bytes_sent_total{nic="Intel_R__PRO_1000_MT_Desktop_Adapter"} 136545
Our Prometheus collector visualizes these metrics into separate charts, despite them being tightly connected:
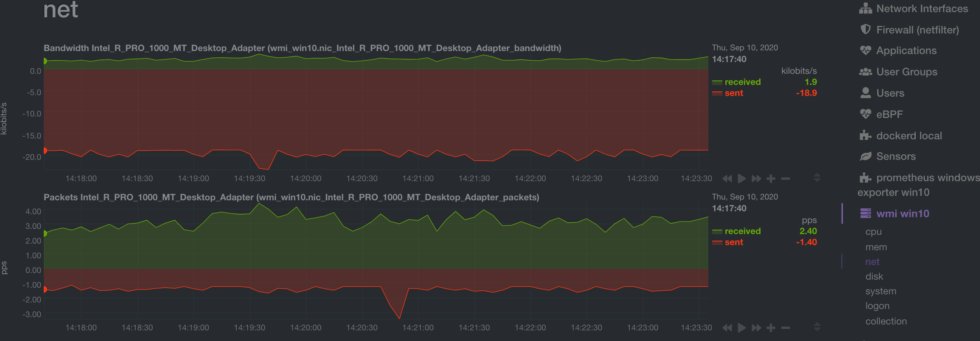
In contrast, our supported collectors are built to visualize meaningful information, and not just raw data, about what’s happening on your systems and applications. With every collector we create, our team investigates the exposed metrics and makes conscious design decisions about how to name, sort, and group charts based on how they’re used in real infrastructure. This additional logic helps you make decisions about your per-second metrics, and not just watch them pass by.
Our WMI collector is a good example of this logic in action. Instead of separate charts for bytes received and sent, we combine these metrics into a single chart to help you understand the status of your system faster.
Meaningful presentation via grouping
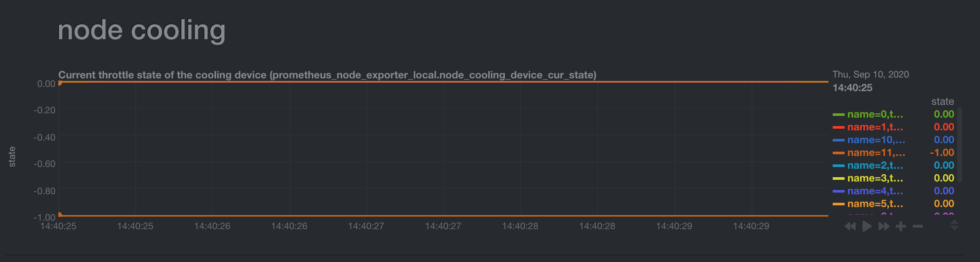
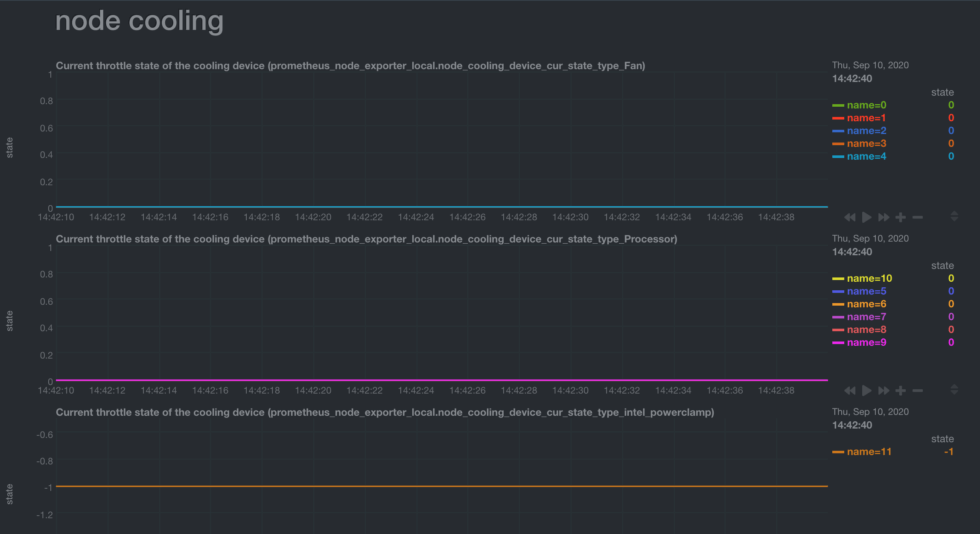
The new filtering and grouping options help you make visualizations of Prometheus metrics more meaningful, just like the WMI charts and all our supported collectors. Let’s look at another example of raw Prometheus metrics for device cooling states:node_cooling_device_cur_state{name="0",type="Fan"} 0
node_cooling_device_cur_state{name="1",type="Fan"} 0
node_cooling_device_cur_state{name="10",type="Processor"} 0
node_cooling_device_cur_state{name="11",type="intel_powerclamp"} -1
node_cooling_device_cur_state{name="2",type="Fan"} 0
node_cooling_device_cur_state{name="3",type="Fan"} 0
node_cooling_device_cur_state{name="4",type="Fan"} 0
node_cooling_device_cur_state{name="5",type="Processor"} 0
node_cooling_device_cur_state{name="6",type="Processor"} 0
node_cooling_device_cur_state{name="7",type="Processor"} 0
node_cooling_device_cur_state{name="8",type="Processor"} 0
node_cooling_device_cur_state{name="9",type="Processor"} 0
By default, the Prometheus collector will create a single chart with all of these metrics as separate dimensions. While that’s convenient, it might not be particularly useful, since the devices are completely different.
With the new grouping configuration, you can change the default grouping so it’s by type rather than the shared label for all those metrics:
group:
 - selector: node_cooling_device_cur_state
   by_label: type
And the resulting, more meaningful charts:
Tame the firehose with filtering
The new filtering feature helps you collect and visualize only the most relevant metrics to your needs. Instead of trying to sort through a firehose of unsorted metrics, some of which might not have useful HELP statements, you can quickly build more focused and meaningful dashboards to troubleshoot faster.You can read about the time series selector (filtering) and time series grouping options in the Prometheus collector docs right now.
If you’re an early adopter of the Prometheus collector, and want to dive into filtering/grouping right away, we encourage you to post in our Community forum. We’d love to see real-world configurations based on your infrastructure and the metrics you get with the Prometheus collector!
Netdata Cloud gets smarter and darker
While we’ve made a lot of improvement on the open-source Netdata Agent, our team has been equally busy on adding new features to Netdata Cloud. These features enrich, improve, and make your nodes’ metrics even more accessible than ever.Faster root cause analysis, for free
The Prometheus collector improvements described above brought a new layer of meaningful presentation to the Netdata Agent, and we just couldn’t let Netdata Cloud go without similar enhancements.Today, we released Metric Correlations, which helps you troubleshoot complex performance problems using every available metric.
Metric Correlations is an exploratory analytics tool that assesses all available metrics to find relevant correlations for a given time period. With it, you can speed up your organization’s mean time to resolution (MTTR) by clicking a single button to analyze more than 2,000 metrics at per-second granularity.
We’re incredibly excited for this feature, as it makes troubleshooting with Netdata even easier—and it’s still entirely free. Check out our blog for details on how we implemented this insightful feature.
Dark mode is here
By popular demand! Our designers have been hard at work, not only on dark mode, but also creating multiple new palettes to please everyone’s eyes, no matter their preference. You can now choose between three themes: Dark, Blue, and Light.Change your preference by clicking on your user icon, then Profile. Click the Settings tab, then the theme of your choice.
Pin dashboards for analysis across nodes, War Rooms, and Spaces
While our dashboards feature gives you the power to create entirely new Netdata dashboard experiences, you might still want to be able to view a new dashboard in relation to other metrics across your infrastructure.When you view any dashboard you’ve built, you can now click the Pin button, which drops the dashboard into a separate panel on the bottom of your screen. The dashboard now follows you around as you navigate around Netdata Cloud, from individual Cloud dashboards, the Nodes view, different War Rooms, or even different Spaces.
Flexible and powerful filtering
As you add more nodes from your infrastructure to Netdata Cloud, you need better ways to sort through the chaos, especially if you’re dealing with an ongoing issue or anomaly.You can now use relational operators (==, !=, contains, and !contains) and logical operators (AND, OR), plus the name, OS, or services running on your nodes to quickly turn any War Room into a focused troubleshooting interface.
A healthier link between Agent and Cloud
Those who use Netdata Cloud should start seeing more responsiveness when viewing their nodes’ metrics thanks to improvements we made to the Agent-Cloud link. First, we added more robust disconnect and reconnect capabilities to avoid nodes in unreachable states despite still running the Netdata Agent locally. Because we’re believers in zero-configuration and out-of-the-box functionality, we also believe you shouldn’t have to restart your Agents, or the whole node itself, just to see its metrics in Netdata Cloud.Second, we added compression to the ACLK and the data it streams through Netdata Cloud and to your browser when you view a dashboard. This compression reduces the size of the payloads, minimizing bandwidth usage and getting data to your browser faster. You’ll see the compression at work most when you view a node’s dashboard. Charts load faster as you scroll, and there’s less latency between updates.
Contributors
We’re incredibly pleased to see a groundswell of contributions go live in v1.25 of the Netdata Agent. These ambitious folks are improving Netdata on a few important fronts, like packaging, collector, and documentation.- @mklepaczewski for adding a JSON log parser to the go.d/web_log collector.
- @glesys-andreas for adding socket support for the go.d/phpfpm collector.
- @K900 for adding and documenting how to read container names from Podman.
- @pando85 for fixing the link to Caddyfile’s basicauth in the Docker documentation.
- @roedie for improving Debian packaging by streamlining control and init files.
- @vsc55 for adding support for IP ranges in the python.d/isc_dhcpd collector.
- @mrbarletta for fixing MySQL collector documentation to mention the netdata user.
- @Saruspete for fixing RPM build script version issues.
- @michmach for improving the uninstall script to correctly state if the group was deleted.
- @Steve8291 for removing PrivateMounts in systemd journal logs.
- @mrbrutti for updating netdata-installer.sh to enable Netdata Cloud support in macOS.
- @weijing24 for adding RAM info for macOS to system-info.sh.
- @scottymuse for fixing latency-avg chart units in the python.d/dnsdist collector.
- @Ancairon for improving proc.plugin to collect the active processes limit on Linux systems.
- @scatenag for fixing TLS over LDAP in the python.d/openldap collector.
- @florianmagnin for adding new options to the python.d/varnish collector for multiple storage backends.
- @devinrsmith for fixing the print message when building for Ubuntu Focal.
Check out the release notes on GitHub for a changelog of every bug fix and improvement.