The perception that Netdata is only capable of short-term metrics storage is a myth. It’s a pervasive myth we still see in blog posts and through community engagement, despite it being false for more than a year.
However, like all myths, this one on metrics storage began with a kernel of truth. When Netdata first flourished as an open-source project in 2017 and 2018, the default metrics database was RAM-only. You could configure this database’s size, but for many users, that size was limited by the amount of RAM they were willing to allocate for metrics storage. We also kept the default value low to ensure Netdata worked efficiently on all hardware and a variety of operating systems.
The database engine, which we first released in May 2019 as part of v1.15 of the Netdata Agent, solved the initial lack of long-term metrics storage in Netdata. This release revolutionized Netdata’s database storage solution, allowing every node to use both RAM and disk to efficiently store days, weeks, or months worth of per-second data.
To rewrite a myth, one needs to present another version of the story. How about this? Through an innovative metrics storage database and a distributed data architecture, Netdata has a versatile, scalable, and cost-effective solution for long-term metrics storage.
‘Spilling’ the beans on database storage
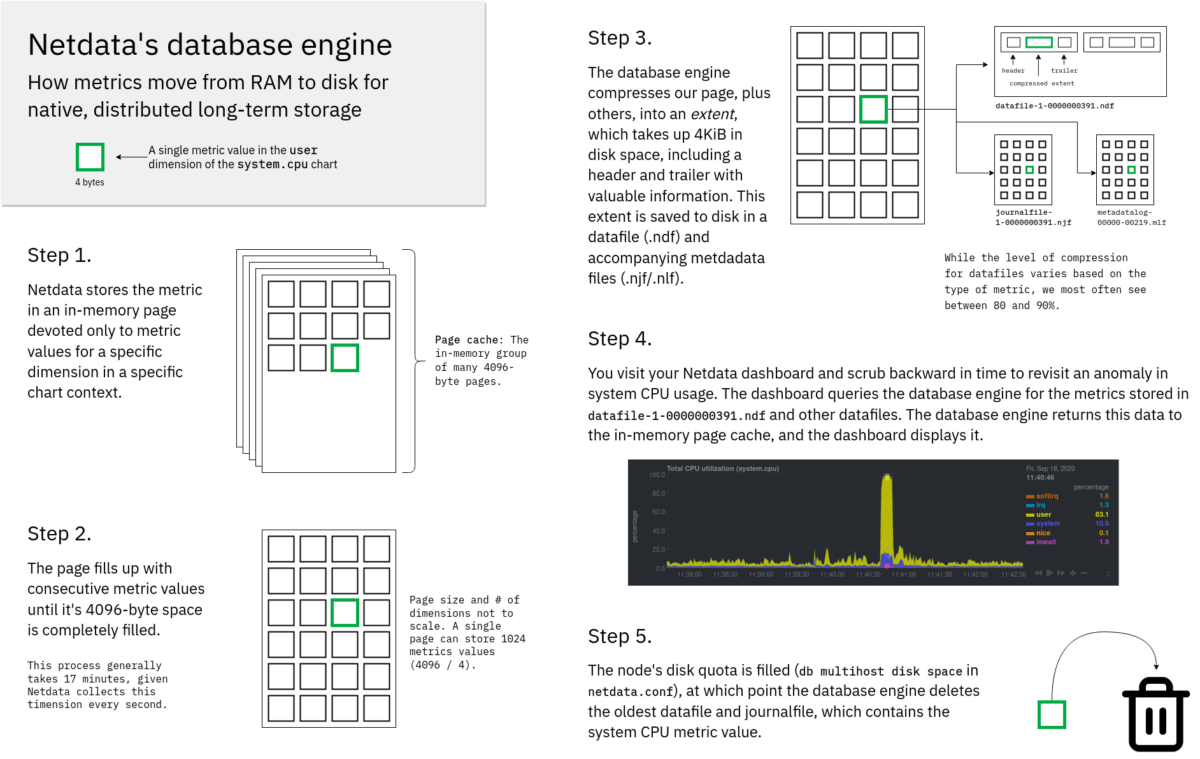
The database engine is a time-series database with a few twists to make it ideal for distributed, scalable, long-term storage of highly granular metrics.When the Netdata Agent collects metrics from its system, it stores the most chart metric values in memory. Each dimension gets its own 4096-byte page, with Netdata’s many collectors continuing to fill these pages with consecutive values. These pages are the page cache.
It takes about 17 minutes for Netdata to fill a single page, given it’s collecting metrics every second, and every metric value requires 4 bytes (4096 bytes / 4 bytes = 1024 seconds, or 17 minutes). When the page fills up, it’s still too “hot” and “dirty” to be evicted from the cache, but the database engine already begins spilling it to disk. Once the page has been written to disk (at a low enough rate to not interfere with the host system and applications), it becomes a candidate for eviction.
The database engine runs an orthogonal process for evicting pages from the page cache. It looks for the least recently-used page, and if that page has already been spilled to disk, and thus marked “clean,” the database engine evicts it from the cache, clearing up a little bit of space in memory.
Back to the disk. The database engine organizes many pages into a single extent, which are immutable sets of 4 KiB blocks, with each block containing exactly one page. It also aligns extents at 4 KiB to enable direct I/O access, so as to minimize system interference and ensure efficient and high-performance I/O requests.
The extent is compressed using a low-overhead algorithm (lz4), given a header and trailer, and stored in a datafile, like datafile-1-0000000391.ndf. The extent’s header stores details like the compression algorithm type, number of completed pages of data inside the extent, arrays for start time and sampling rate, and much more. The trailer stores a checksum of the extent.
The database engine also creates a few metadata files, such as .njf and .mlf files, which contain important metadata required to resurface metrics stored on disk.
Resurfacing becomes useful when you want to view historical metrics, stored on disk, for troubleshooting or root cause analysis. As you scrub backward in time in Netdata, the dashboard queries the database engine for historical metrics, which then fills the in-memory page cache with the requested pages. By resurfacing historical metrics into memory, you get a much smoother (and less I/O intensive) experience when you interact with charts.
When the datafiles and journalfiles exceed the default or user-defined disk space quota, the database engine then removes the oldest data/journalfiles along with any data/metadata that still resides in the in-memory cache.
See the journey of a metric value through the wonders of the database engine:

Let’s say you have a system that collects 2,000 metrics every second. Given a compression ratio of 80%, which we’ve found is pretty standard for production systems, the database engine can store a year’s worth of per-second metrics using 48GiB of disk space.
That’s 63,072,000,000 valuable points of data for a few dollar’s worth of disk space.
Netdata’s time-series database is fully capable of long-term metrics storage. That much should be clear. But what’s even more important is why Netdata’s solution is so much more versatile than other monitoring solutions.
Low cost, high scalability, total ownership
The database engine’s architecture means more than highly-compressed metrics.Let’s say you have an infrastructure with 100 nodes, a mixture of VMs and bare metal. With other monitoring solutions, you’re streaming all those metrics to a data lake in the cloud. If you expand to 200 nodes, your costs just doubled, and that’s even at the low-resolution, 10-second granularity that other solutions offer.
Centralized metrics makes scaling your infrastructure monitoring difficult. Even worse, the metrics aren’t yours any more. Good luck downloading your data and migrating to another platform.
The database engine’s most powerful feature is distributed metrics, stored locally on each node. By abandoning the expensive data lake and using the disk space available for each nod, you can keep costs down. There’s no extra expense when you jump to 200 nodes, or even 1,000. That means you can scale your infrastructure as you see fit without worrying about whether your monitoring stack can keep up.
Even better, you maintain complete control of your metrics. With Netdata Cloud, you can view and interact with your metrics in a single pane of glass while storing all the data on your distributed nodes. When you view or navigate a dashboard in Netdata Cloud, it makes a request to your node to stream those metrics to your browser on-demand.
This is why Netdata Cloud doesn’t store any metrics from our users’ nodes. Doing so would undermine the entire purpose of the distributed data model and the elegance of the database engine itself. Plus, it would worsen the experience for our most active users.
Change your metrics retention policy
If you want to store more metrics on a given node, you only need to change a single configuration setting. Thedbengine multihost disk space setting dictates how much disk space, in MiB, you want to allocate for long-term metrics storage.The default setting is 256 MiB. For a system collecting 2,000 metrics every second, and 80% compression, that’s roughly two days of metrics at 1s granularity.
[global]
    dbengine multihost disk space = 256
If you want four days, double the setting to 512. Eight days? 1024.
Not sure what you want? Or do you need some more information about how much disk space and RAM a given setting will require? We have a calculator for that. Enter the metrics retention you’d like, tweak the other inputs, and see a recommended setting for dbengine multihost disk space. You can even calculate the database engine’s size when streaming multiple child nodes to a single parent.
Myth-busting with our community
Rewriting myths is a community effort. We’re trying to do our part with this post and documentation, but we encourage our community to spread this new story. And, when it makes sense, help us debunk instances of the myth when you find them.If you have questions about Netdata’s long-term metrics storage or the database engine’s intricacies, feel free to post in our community forum. A large chunk of the engineering and product team are active there and are ready to engage if you have questions.
We even created a thread specific to this blog post. We’re especially curious to hear about how you might be using Netdata’s distributed data model in your work’s monitoring stack. The more we know about how Netdata is used in the wild, so to speak, the better we can not only squash the existing myths, but also create new stories that better reflect Netdata’s rapidly-changing reality.


