The only agent that thinks for itself

Autonomous Monitoring with self-learning AI built-in, operating independently across your entire stack.

Unlimited Metrics & Logs
Machine learning & MCP
5% CPU, 150MB RAM
3GB disk, >1 year retention
800+ integrations, zero config
Dashboards, alerts out of the box
> Discover Netdata Agents
Centralized metrics streaming and storage

Aggregate metrics from multiple agents into centralized Parent nodes for unified monitoring across your infrastructure.

Stream from unlimited agents
Long-term data retention
High availability clustering
Data replication & backup
Scalable architecture
Enterprise-grade security
> Learn about Parents
Fully managed cloud platform

Access your monitoring data from anywhere with our SaaS platform. No infrastructure to manage, automatic updates, and global availability.

Zero infrastructure management
99.9% uptime SLA
Global data centers
Automatic updates & patches
Enterprise SSO & RBAC
SOC2 & ISO certified
> Explore Netdata Cloud
Deploy Netdata Cloud in your infrastructure

Run the full Netdata Cloud platform on-premises for complete data sovereignty and compliance with your security policies.

Complete data sovereignty
Air-gapped deployment
Custom compliance controls
Private network integration
Dedicated support team
Kubernetes & Docker support
> Learn about Cloud On-Premises
Powerful, intuitive monitoring interface

Modern, responsive UI built for real-time troubleshooting with customizable dashboards and advanced visualization capabilities.

Real-time chart updates
Customizable dashboards
Dark & light themes
Advanced filtering & search
Responsive on all devices
Collaboration features
> Explore Netdata UI
Monitor on the go

Native iOS and Android apps bring full monitoring capabilities to your mobile device with real-time alerts and notifications.

iOS & Android apps
Push notifications
Touch-optimized interface
Offline data access
Biometric authentication
Widget support
> Download apps

Best energy efficiency

True real-time per-second

100% automated zero config

Centralized observability

Multi-year retention

High availability built-in

Zero maintenance

Always up-to-date

Enterprise security

Complete data control

Air-gap ready

Compliance certified

Millisecond responsiveness

Infinite zoom & pan

Works on any device

Native performance

Instant alerts

Monitor anywhere

80% Faster Incident Resolution
AI-powered troubleshooting from detection, to root cause and blast radius identification, to reporting.
True Real-Time and Simple, even at Scale
Linearly and infinitely scalable full-stack observability, that can be deployed even mid-crisis.
90% Cost Reduction, Full Fidelity
Instead of centralizing the data, Netdata distributes the code, eliminating pipelines and complexity.
Control Without Surrender
SOC 2 Type 2 certified with every metric kept on your infrastructure.
Integrations

800+ collectors and notification channels, auto-discovered and ready out of the box.

800+ data collectors
Auto-discovery & zero config
Cloud, infra, app protocols
Notifications out of the box
> Explore integrations
Real Results
46% Cost Reduction

Reduced monitoring costs by 46% while cutting staff overhead by 67%.

— Leonardo Antunez, Codyas

Zero Pipeline

No data shipping. No central storage costs. Query at the edge.

From Our Users
"Out-of-the-Box"

So many out-of-the-box features! I mostly don't have to develop anything.

— Simon Beginn, LANCOM Systems

No Query Language

Point-and-click troubleshooting. No PromQL, no LogQL, no learning curve.

Enterprise Ready
67% Less Staff, 46% Cost Cut

Enterprise efficiency without enterprise complexity—real ROI from day one.

— Leonardo Antunez, Codyas

SOC 2 Type 2 Certified

Zero data egress. Only metadata reaches the cloud. Your metrics stay on your infrastructure.

Full Coverage
800+ Collectors

Auto-discovered and configured. No manual setup required.

Any Notification Channel

Slack, PagerDuty, Teams, email, webhooks—all built-in.

Built for the People Who Get Paged
Because 3am alerts deserve instant answers, not hour-long hunts.
Every Industry Has Rules. We Master Them.
See how healthcare, finance, and government teams cut monitoring costs 90% while staying audit-ready.
Monitor Any Technology. Configure Nothing.
Install the agent. It already knows your stack.
From Our Users
"A Rare Unicorn"

Netdata gives more than you invest in it. A rare unicorn that obeys the Pareto rule.

— Eduard Porquet Mateu, TMB Barcelona

99% Downtime Reduction

Reduced website downtime by 99% and cloud bill by 30% using Netdata alerts.

— Falkland Islands Government

Real Savings
30% Cloud Cost Reduction

Optimized resource allocation based on Netdata alerts cut cloud spending by 30%.

— Falkland Islands Government

46% Cost Cut

Reduced monitoring staff by 67% while cutting operational costs by 46%.

— Codyas

Real Coverage
"Plugin for Everything"

Netdata has agent capacity or a plugin for everything, including Windows and Kubernetes.

— Eduard Porquet Mateu, TMB Barcelona

"Out-of-the-Box"

So many out-of-the-box features! I mostly don't have to develop anything.

— Simon Beginn, LANCOM Systems

Real Speed
Troubleshooting in 30 Seconds

From 2-3 minutes to 30 seconds—instant visibility into any node issue.

— Matthew Artist, Nodecraft

20% Downtime Reduction

20% less downtime and 40% budget optimization from out-of-the-box monitoring.

— Simon Beginn, LANCOM Systems

Pay per Node. Unlimited Everything Else.

One price per node. Unlimited metrics, logs, users, and retention. No per-GB surprises.

Free tier—forever
No metric limits or caps
Retention you control
Cancel anytime
> See pricing plans
What's Your Monitoring Really Costing You?

Most teams overpay by 40-60%. Let's find out why.

Expose hidden metric charges
Calculate tool consolidation
Customers report 30-67% savings
Results in under 60 seconds
> See what you're really paying
Your Infrastructure Is Unique. Let's Talk.

Because monitoring 10 nodes is different from monitoring 10,000.

On-prem & air-gapped deployment
Volume pricing & agreements
Architecture review for your scale
Compliance & security support
> Start a conversation
Monitoring That Sells Itself

Deploy in minutes. Impress clients in hours. Earn recurring revenue for years.

30-second live demos close deals
Zero config = zero support burden
Competitive margins & deal protection
Response in 48 hours
> Apply to partner
Per-Second Metrics at Homelab Prices

Same engine, same dashboards, same ML. Just priced for tinkerers.

Community: Free forever · 5 nodes · non-commercial
Homelab: $90/yr · unlimited nodes · fair usage
> Start monitoring your lab—free
$1,000 Per Referral. Unlimited Referrals.

Your colleagues get 10% off. You get 10% commission. Everyone wins.

10% of subscriptions, up to $1,000 each
Track earnings inside Netdata Cloud
PayPal/Venmo payouts in 3-4 weeks
No caps, no complexity
> Get your referral link
Cost Proof
40% Budget Optimization

"Netdata's significant positive impact" — LANCOM Systems

Calculate Your Savings

Compare vs Datadog, Grafana, Dynatrace

Savings Proof
46% Cost Reduction

"Cut costs by 46%, staff by 67%" — Codyas

30% Cloud Bill Savings

"Reduced cloud bill by 30%" — Falkland Islands Gov

Enterprise Proof
"Better Than Combined Alternatives"

"Better observability with Netdata than combining other tools." — TMB Barcelona

Real Engineers, <24h Response

DPA, SLAs, on-prem, volume pricing

Why Partners Win
Demo Live Infrastructure

One command, 30 seconds, real data—no sandbox needed

Zero Tickets, High Margins

Auto-config + per-node pricing = predictable profit

Homelab Ready
"Absolutely Incredible"

"We tested every monitoring system under the sun." — Benjamin Gabler, CEO Rocket.Net

76k+ GitHub Stars

3rd most starred monitoring project

Worth Recommending
Product That Delivers

Customers report 40-67% cost cuts, 99% downtime reduction

Zero Risk to Your Rep

Free tier lets them try before they buy

Never Fight Fires Alone

Docs, community, and expert help—pick your path to resolution.

Learn.netdata.cloud docs
Discord, Forums, GitHub
Premium support available
> Get answers now
60 Seconds to First Dashboard

One command to install. Zero config. 850+ integrations documented.

Linux, Windows, K8s, Docker
Auto-discovers your stack
> Read our documentation
See Netdata in Action

Watch real-time monitoring in action—demos, tutorials, and engineering deep dives.

Product demos and walkthroughs
Real infrastructure, not staged
> Start with the 3-minute tour
Level Up Your Monitoring
Real problems. Real solutions. 112+ guides from basic monitoring to AI observability.
76,000+ Engineers Strong
615+ contributors. 1.5M daily downloads. One mission: simplify observability.
Per-Second. 90% Cheaper. Data Stays Home.
Side-by-side comparisons: costs, real-time granularity, and data sovereignty for every major tool.

See why teams switch from Datadog, Prometheus, Grafana, and more.

> Browse all comparisons
Edge-Native Observability, Born Open Source
Per-second visibility, ML on every metric, and data that never leaves your infrastructure.
Founded in 2016
615+ contributors worldwide
Remote-first, engineering-driven
Open source first
> Read our story
Promises We Publish—and Prove
12 principles backed by open code, independent validation, and measurable outcomes.
Open source, peer-reviewed
Zero config, instant value
Data sovereignty by design
Aligned pricing, no surprises
> See all 12 principles
Edge-Native, AI-Ready, 100% Open
76k+ stars. Full ML, AI, and automation—GPLv3+, not premium add-ons.
76,000+ GitHub stars
GPLv3+ licensed forever
ML on every metric, included
Zero vendor lock-in
> Explore our open source
Build Real-Time Observability for the World
Remote-first team shipping per-second monitoring with ML on every metric.
Remote-first, fully distributed
Open source (76k+ stars)
Challenging technical problems
Your code on millions of systems
> See open roles
Talk to a Netdata Human in <24 Hours
Sales, partnerships, press, or professional services—real engineers, fast answers.
Discuss your observability needs
Pricing and volume discounts
Partnership opportunities
Media and press inquiries
> Book a conversation
Your Data. Your Rules.
On-prem data, cloud control plane, transparent terms.
Trust & Scale
76,000+ GitHub Stars

One of the most popular open-source monitoring projects

SOC 2 Type 2 Certified

Enterprise-grade security and compliance

Data Sovereignty

Your metrics stay on your infrastructure

Validated
University of Amsterdam

"Most energy-efficient monitoring solution" — ICSOC 2023, peer-reviewed

ADASTEC (Autonomous Driving)

"Doesn't miss alerts—mission-critical trust for safety software"

Community Stats
615+ Contributors

Global community improving monitoring for everyone

1.5M+ Downloads/Day

Trusted by teams worldwide

GPLv3+ Licensed

Free forever, fully open source agent

Why Join?
Remote-First

Work from anywhere, async-friendly culture

Impact at Scale

Your work helps millions of systems

Compliance
SOC 2 Type 2

Audited security controls

GDPR Ready

Data stays on your infrastructure

Netdata vs Lansweeper

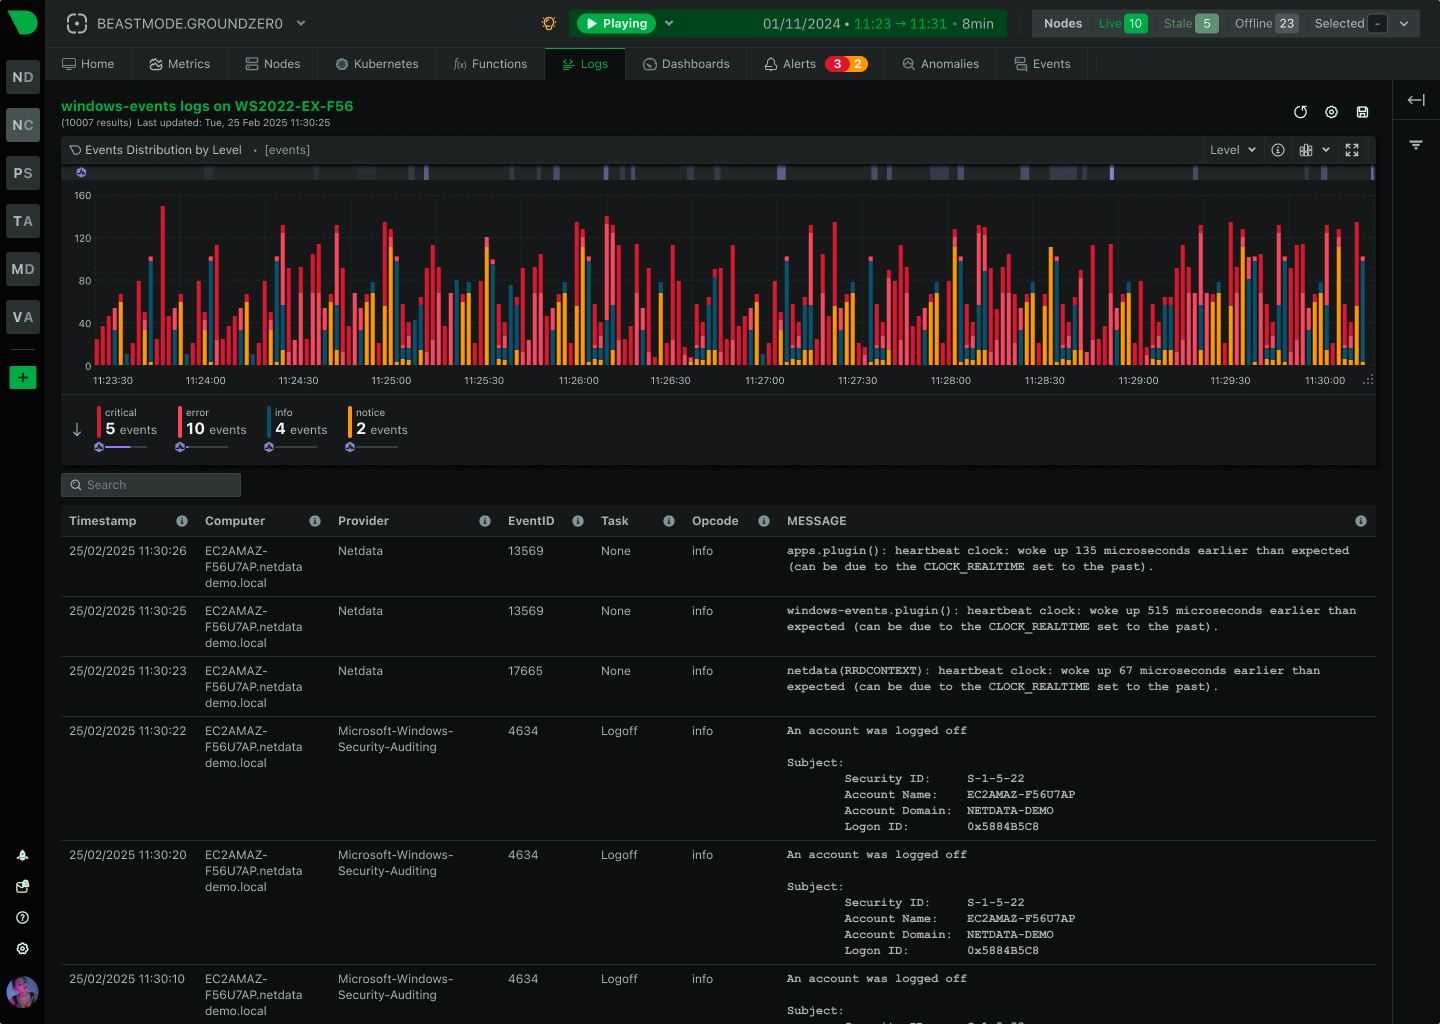
Complete Your IT Operations Stack with Real-Time Visibility

Lansweeper tells you what assets you have. Netdata shows you how they’re performing - right now. Add per-second monitoring, ML-based anomaly detection, and AI-powered troubleshooting to your ITAM foundation without replacing what already works.

Background Hero

Why Lansweeper Customers Choose Netdata

Complementary solutions for complete IT operations

True Real-Time Monitoring

Per-second metrics with sub-2-second latency - not hourly scans. See performance issues as they happen, not hours later.

AI-Powered Troubleshooting

Ask questions in plain English, get root cause analysis in seconds. No SQL knowledge required, no query languages to learn.

ML Anomaly Detection

18 models per metric detect issues automatically. 99% false positive reduction through consensus-based detection.

90% Cost Reduction

Replace Prometheus+Grafana+ELK stack with one platform. Predictable per-node pricing, no volume-based charges.

Zero Configuration

Install in 60 seconds, get instant dashboards. No SQL schemas to learn, no dashboards to build, no PromQL required.

Complementary Design

Keep Lansweeper for ITAM. Add Netdata for real-time monitoring. Both tools working together for complete visibility.

Trusted by operations teams worldwide

Platform Comparison

Netdata vs Lansweeper: Understanding the Difference

These tools serve different purposes and excel in different domains. Lansweeper is purpose-built for IT Asset Management (ITAM), while Netdata is purpose-built for Real-Time Observability. Most organizations use both.

Capability

Netdata

Lansweeper

Primary Purpose

Real-Time Monitoring
How is infrastructure performing right now?

IT Asset Management
What assets exist in the environment?

Data Granularity

✅ Per-Second Continuous
86,400 data points per metric per day

⚠️ Hourly/Daily Scans
Periodic snapshots, not continuous monitoring

Visualization Latency

✅ Sub-2 Seconds
Event to dashboard in real-time

⚠️ Minutes to Hours
Depends on scan schedule and frequency

Machine Learning

✅ Ideal
18 models per metric, automatic anomaly detection

❌ Not Available
No ML-based anomaly detection capabilities

AI Capabilities

✅ Ideal
AI Co-Engineer, Ask AI, automated insights

❌ Not Available
No AI-powered troubleshooting or analysis

Query Language

✅ None Required
Point-and-click analysis, natural language AI

⚠️ SQL Mandatory
Custom reports require SQL knowledge

Dashboard Building

✅ Automated
Algorithmic generation, zero configuration

⚠️ Manual
SQL-based report building required

Asset Inventory

❌ Not Available
Not an ITAM tool, monitors performance only

✅ Advanced
Comprehensive asset discovery and tracking

License Compliance

❌ Not Available
Not designed for software license tracking

✅ Advanced
Core ITAM feature with compliance reporting

Database Scalability

✅ Unlimited
Custom DBENGINE, no SQL Server licensing

⚠️ Limited
SQL Compact 10GB limit, requires SQL Server

Agent Resource Usage

✅ <5% CPU Steady
150-200MB RAM, university validated efficiency

⚠️ Variable with Spikes
CPU spikes during scans, 1GB+ RAM

Pricing Model

✅ Predictable Per-Node
Flat per-node pricing, unlimited metrics and users

⚠️ Asset-Based Blocks
Minimum asset blocks, variable pricing tiers

Transform Your Operations with Real-Time Intelligence

See Problems Before They Escalate

Lansweeper’s hourly scans miss critical performance issues. Netdata’s per-second monitoring with ML anomaly detection catches problems in real-time - before they impact users. 80% MTTR reduction validated by customers.

80% Faster Resolution

Learn About ML Detection

See Problems Before They Escalate

Troubleshoot Without SQL Expertise

Stop requiring SQL knowledge for basic reports. Netdata’s algorithmic dashboards and AI-powered insights deliver senior-level analysis to everyone on your team - with simple point-and-click or natural language queries.

Zero Query Languages

See AI Troubleshooting

Troubleshoot Without SQL Expertise

Scale Without Database Limits

Lansweeper hits SQL Compact’s 10GB limit at ~1,000 assets, forcing expensive SQL Server upgrades. Netdata’s distributed architecture scales to 100,000+ nodes with no central database bottleneck - and no SQL licensing costs.

Unlimited Scale

Explore Architecture

Scale Without Database Limits

Consolidate Your Monitoring Stack

Replace Prometheus+Grafana+ELK complexity with one platform. Netdata provides real-time metrics, logs without pipelines, and AI-powered troubleshooting - all with zero configuration. Keep Lansweeper for ITAM, simplify everything else.

90% Cost Reduction

Calculate Your Savings

Consolidate Your Monitoring Stack

Monitoring Features Side by Side

Real-Time Monitoring Capabilities

Netdata excels at real-time performance monitoring and troubleshooting - the capabilities Lansweeper’s ITAM focus cannot provide. These tools are complementary, not competing.

Feature

Netdata

Lansweeper

Real-Time Metrics

✅ Per-Second Continuous
3,000-20,000 metrics/s per node, sub-2s latency

⚠️ Periodic Scans
Hourly/daily snapshots, minutes to hours delay

Application Monitoring

✅ 800+ Integrations
Databases, web servers, message brokers, caches

⚠️ Basic Detection
Running applications only, no performance metrics

Database Monitoring

✅ Advanced
PostgreSQL, MySQL, MongoDB, Redis with query metrics

❌ Not Available
No database performance monitoring capabilities

Container Monitoring

✅ Advanced
Docker, Kubernetes, LXC with per-container metrics

⚠️ Basic Inventory
Container detection only, limited performance data

Process Monitoring

✅ Per-Process Resources
CPU, RAM, disk I/O, network per process

⚠️ Running Processes
Process list only, no resource tracking

Network Performance

✅ Per-Second Bandwidth
Interface metrics, connections, latency, QoS

⚠️ Basic SNMP
Device inventory, limited performance data

Logs Management

✅ Native Access
systemd-journal, Windows Event Logs, no pipelines

⚠️ Basic Collection
Event log scanning, limited analysis capabilities

Anomaly Detection

✅ ML-Based Automatic
18 models per metric, 99% false positive reduction

❌ Not Available
No machine learning or anomaly detection

Root Cause Analysis

✅ AI-Powered
Anomaly Advisor correlation, blast radius detection

⚠️ Manual Analysis
SQL-based investigation required

Synthetic Monitoring

✅ Built-In
HTTP, TCP, DNS checks with alerting

❌ Not Available
No synthetic monitoring capabilities

Cross-Platform Support

✅ Feature Parity
Linux = macOS = Windows = FreeBSD

⚠️ Windows-Best
Mac/Linux functionality limited vs Windows

Time to First Insight

✅ 60 Seconds
Install to dashboard with zero configuration

⚠️ Hours to Days
Scanning, database setup, report building

See All Integrations

Netdata's Real-Time Advantages

Catch Issues Automatically

18 unsupervised ML models per metric detect anomalies in real-time with 99% false positive reduction. No configuration, no tuning - just automatic detection after 15 minutes of baseline.

University validated as most energy-efficient monitoring

Learn About ML
ML Detection Dashboard

Use Case Comparison

When to Use Each Tool

Netdata and Lansweeper serve different operational needs. Most organizations benefit from using both - Lansweeper for asset management and compliance, Netdata for real-time monitoring and troubleshooting.

Use Case

Netdata

Lansweeper

Real-Time Troubleshooting

✅ Ideal
Per-second metrics, ML detection, AI root cause

⚠️ Limited
Periodic scans miss transient issues

Performance Monitoring

✅ Ideal
Continuous monitoring, anomaly detection, trends

⚠️ Basic
Performance counters only, no continuous tracking

Capacity Planning

✅ Advanced
ML-based predictions, resource trends, forecasting

✅ Good
Hardware inventory, refresh cycles, asset lifecycle

Asset Inventory

❌ Not Available
Not designed for asset management

✅ Advanced
Comprehensive discovery, tracking, reporting

License Compliance

❌ Not Available
Not designed for software license tracking

✅ Advanced
Core ITAM feature with audit reports

Incident Response

✅ Ideal
Real-time data, AI analysis, 80% MTTR reduction

⚠️ Limited
Historical data only, manual investigation

Compliance Reporting

⚠️ Basic
Performance SLAs, availability metrics

✅ Advanced
NIST, IEC 62443 framework mapping, audit trails

Helpdesk Enrichment

✅ Advanced
Current performance, recent anomalies, live logs

✅ Advanced
Asset details, warranty info, purchase history

Network Topology

⚠️ Limited
Connection tracking, no visual mapping

✅ Advanced
Visual device relationships, network diagrams

OT/ICS Monitoring

⚠️ Basic
SNMP monitoring, limited protocol support

✅ Advanced
14+ ICS protocols, comprehensive OT discovery

Console Replacement

✅ Ideal
Browser-based debugging with history and ML

❌ Not Available
Not designed for live system debugging

DevOps Workflows

✅ Ideal
CI/CD integration, Kubernetes native, GitOps

⚠️ Limited
Asset tracking focus, not DevOps optimized

Frequently Asked Questions