The only agent that thinks for itself

Autonomous Monitoring with self-learning AI built-in, operating independently across your entire stack.

Unlimited Metrics & Logs
Machine learning & MCP
5% CPU, 150MB RAM
3GB disk, >1 year retention
800+ integrations, zero config
Dashboards, alerts out of the box
> Discover Netdata Agents

Centralized metrics streaming and storage

Aggregate metrics from multiple agents into centralized Parent nodes for unified monitoring across your infrastructure.

Stream from unlimited agents
Long-term data retention
High availability clustering
Data replication & backup
Scalable architecture
Enterprise-grade security
> Learn about Parents

Fully managed cloud platform

Access your monitoring data from anywhere with our SaaS platform. No infrastructure to manage, automatic updates, and global availability.

Zero infrastructure management
99.9% uptime SLA
Global data centers
Automatic updates & patches
Enterprise SSO & RBAC
SOC2 & ISO certified
> Explore Netdata Cloud

Deploy Netdata Cloud in your infrastructure

Run the full Netdata Cloud platform on-premises for complete data sovereignty and compliance with your security policies.

Complete data sovereignty
Air-gapped deployment
Custom compliance controls
Private network integration
Dedicated support team
Kubernetes & Docker support
> Learn about Cloud On-Premises

Powerful, intuitive monitoring interface

Modern, responsive UI built for real-time troubleshooting with customizable dashboards and advanced visualization capabilities.

Real-time chart updates
Customizable dashboards
Dark & light themes
Advanced filtering & search
Responsive on all devices
Collaboration features
> Explore Netdata UI

Monitor on the go

Native iOS and Android apps bring full monitoring capabilities to your mobile device with real-time alerts and notifications.

iOS & Android apps
Push notifications
Touch-optimized interface
Offline data access
Biometric authentication
Widget support
> Download apps

Best energy efficiency

True real-time per-second

100% automated zero config

Centralized observability

Multi-year retention

High availability built-in

Zero maintenance

Always up-to-date

Enterprise security

Complete data control

Air-gap ready

Compliance certified

Millisecond responsiveness

Infinite zoom & pan

Works on any device

Native performance

Instant alerts

Monitor anywhere

80% Faster Incident Resolution

AI-powered troubleshooting from detection, to root cause and blast radius identification, to reporting.

True Real-Time and Simple, even at Scale

Linearly and infinitely scalable full-stack observability, that can be deployed even mid-crisis.

90% Cost Reduction, Full Fidelity

Instead of centralizing the data, Netdata distributes the code, eliminating pipelines and complexity.

Control Without Surrender

SOC 2 Type 2 certified with every metric kept on your infrastructure.

Integrations

800+ collectors and notification channels, auto-discovered and ready out of the box.

800+ data collectors
Auto-discovery & zero config
Cloud, infra, app protocols
Notifications out of the box
> Explore integrations
Real Results
46% Cost Reduction

Reduced monitoring costs by 46% while cutting staff overhead by 67%.

— Leonardo Antunez, Codyas

Zero Pipeline

No data shipping. No central storage costs. Query at the edge.

From Our Users
"Out-of-the-Box"

So many out-of-the-box features! I mostly don't have to develop anything.

— Simon Beginn, LANCOM Systems

No Query Language

Point-and-click troubleshooting. No PromQL, no LogQL, no learning curve.

Enterprise Ready
67% Less Staff, 46% Cost Cut

Enterprise efficiency without enterprise complexity—real ROI from day one.

— Leonardo Antunez, Codyas

SOC 2 Type 2 Certified

Zero data egress. Only metadata reaches the cloud. Your metrics stay on your infrastructure.

Full Coverage
800+ Collectors

Auto-discovered and configured. No manual setup required.

Any Notification Channel

Slack, PagerDuty, Teams, email, webhooks—all built-in.

Built for the People Who Get Paged

Because 3am alerts deserve instant answers, not hour-long hunts.

Every Industry Has Rules. We Master Them.

See how healthcare, finance, and government teams cut monitoring costs 90% while staying audit-ready.

Monitor Any Technology. Configure Nothing.

Install the agent. It already knows your stack.
From Our Users
"A Rare Unicorn"

Netdata gives more than you invest in it. A rare unicorn that obeys the Pareto rule.

— Eduard Porquet Mateu, TMB Barcelona

99% Downtime Reduction

Reduced website downtime by 99% and cloud bill by 30% using Netdata alerts.

— Falkland Islands Government

Real Savings
30% Cloud Cost Reduction

Optimized resource allocation based on Netdata alerts cut cloud spending by 30%.

— Falkland Islands Government

46% Cost Cut

Reduced monitoring staff by 67% while cutting operational costs by 46%.

— Codyas

Real Coverage
"Plugin for Everything"

Netdata has agent capacity or a plugin for everything, including Windows and Kubernetes.

— Eduard Porquet Mateu, TMB Barcelona

"Out-of-the-Box"

So many out-of-the-box features! I mostly don't have to develop anything.

— Simon Beginn, LANCOM Systems

Real Speed
Troubleshooting in 30 Seconds

From 2-3 minutes to 30 seconds—instant visibility into any node issue.

— Matthew Artist, Nodecraft

20% Downtime Reduction

20% less downtime and 40% budget optimization from out-of-the-box monitoring.

— Simon Beginn, LANCOM Systems

Pay per Node. Unlimited Everything Else.

One price per node. Unlimited metrics, logs, users, and retention. No per-GB surprises.

Free tier—forever
No metric limits or caps
Retention you control
Cancel anytime
> See pricing plans

What's Your Monitoring Really Costing You?

Most teams overpay by 40-60%. Let's find out why.

Expose hidden metric charges
Calculate tool consolidation
Customers report 30-67% savings
Results in under 60 seconds
> See what you're really paying

Your Infrastructure Is Unique. Let's Talk.

Because monitoring 10 nodes is different from monitoring 10,000.

On-prem & air-gapped deployment
Volume pricing & agreements
Architecture review for your scale
Compliance & security support
> Start a conversation

Monitoring That Sells Itself

Deploy in minutes. Impress clients in hours. Earn recurring revenue for years.

30-second live demos close deals
Zero config = zero support burden
Competitive margins & deal protection
Response in 48 hours
> Apply to partner

Per-Second Metrics at Homelab Prices

Same engine, same dashboards, same ML. Just priced for tinkerers.

Community: Free forever · 5 nodes · non-commercial
Homelab: $90/yr · unlimited nodes · fair usage
> Start monitoring your lab—free

$1,000 Per Referral. Unlimited Referrals.

Your colleagues get 10% off. You get 10% commission. Everyone wins.

10% of subscriptions, up to $1,000 each
Track earnings inside Netdata Cloud
PayPal/Venmo payouts in 3-4 weeks
No caps, no complexity
> Get your referral link
Cost Proof
40% Budget Optimization

"Netdata's significant positive impact" — LANCOM Systems

Calculate Your Savings

Compare vs Datadog, Grafana, Dynatrace

Savings Proof
46% Cost Reduction

"Cut costs by 46%, staff by 67%" — Codyas

30% Cloud Bill Savings

"Reduced cloud bill by 30%" — Falkland Islands Gov

Enterprise Proof
"Better Than Combined Alternatives"

"Better observability with Netdata than combining other tools." — TMB Barcelona

Real Engineers, <24h Response

DPA, SLAs, on-prem, volume pricing

Why Partners Win
Demo Live Infrastructure

One command, 30 seconds, real data—no sandbox needed

Zero Tickets, High Margins

Auto-config + per-node pricing = predictable profit

Homelab Ready
"Absolutely Incredible"

"We tested every monitoring system under the sun." — Benjamin Gabler, CEO Rocket.Net

76k+ GitHub Stars

3rd most starred monitoring project

Worth Recommending
Product That Delivers

Customers report 40-67% cost cuts, 99% downtime reduction

Zero Risk to Your Rep

Free tier lets them try before they buy

Never Fight Fires Alone

Docs, community, and expert help—pick your path to resolution.

Learn.netdata.cloud docs
Discord, Forums, GitHub
Premium support available
> Get answers now

60 Seconds to First Dashboard

One command to install. Zero config. 850+ integrations documented.

Linux, Windows, K8s, Docker
Auto-discovers your stack
> Read our documentation

See Netdata in Action

Watch real-time monitoring in action—demos, tutorials, and engineering deep dives.

Product demos and walkthroughs
Real infrastructure, not staged
> Start with the 3-minute tour

Level Up Your Monitoring

Real problems. Real solutions. 112+ guides from basic monitoring to AI observability.

76,000+ Engineers Strong

615+ contributors. 1.5M daily downloads. One mission: simplify observability.

Per-Second. 90% Cheaper. Data Stays Home.

Side-by-side comparisons: costs, real-time granularity, and data sovereignty for every major tool.

See why teams switch from Datadog, Prometheus, Grafana, and more.

> Browse all comparisons
Edge-Native Observability, Born Open Source
Per-second visibility, ML on every metric, and data that never leaves your infrastructure.
Founded in 2016
615+ contributors worldwide
Remote-first, engineering-driven
Open source first
> Read our story
Promises We Publish—and Prove
12 principles backed by open code, independent validation, and measurable outcomes.
Open source, peer-reviewed
Zero config, instant value
Data sovereignty by design
Aligned pricing, no surprises
> See all 12 principles
Edge-Native, AI-Ready, 100% Open
76k+ stars. Full ML, AI, and automation—GPLv3+, not premium add-ons.
76,000+ GitHub stars
GPLv3+ licensed forever
ML on every metric, included
Zero vendor lock-in
> Explore our open source
Build Real-Time Observability for the World
Remote-first team shipping per-second monitoring with ML on every metric.
Remote-first, fully distributed
Open source (76k+ stars)
Challenging technical problems
Your code on millions of systems
> See open roles
Talk to a Netdata Human in <24 Hours
Sales, partnerships, press, or professional services—real engineers, fast answers.
Discuss your observability needs
Pricing and volume discounts
Partnership opportunities
Media and press inquiries
> Book a conversation
Your Data. Your Rules.
On-prem data, cloud control plane, transparent terms.
Trust & Scale
76,000+ GitHub Stars

One of the most popular open-source monitoring projects

SOC 2 Type 2 Certified

Enterprise-grade security and compliance

Data Sovereignty

Your metrics stay on your infrastructure

Validated
University of Amsterdam

"Most energy-efficient monitoring solution" — ICSOC 2023, peer-reviewed

ADASTEC (Autonomous Driving)

"Doesn't miss alerts—mission-critical trust for safety software"

Community Stats
615+ Contributors

Global community improving monitoring for everyone

1.5M+ Downloads/Day

Trusted by teams worldwide

GPLv3+ Licensed

Free forever, fully open source agent

Why Join?
Remote-First

Work from anywhere, async-friendly culture

Impact at Scale

Your work helps millions of systems

Compliance
SOC 2 Type 2

Audited security controls

GDPR Ready

Data stays on your infrastructure

Netdata vs LibreNMS

Transform Infrastructure Monitoring from Minutes to Seconds

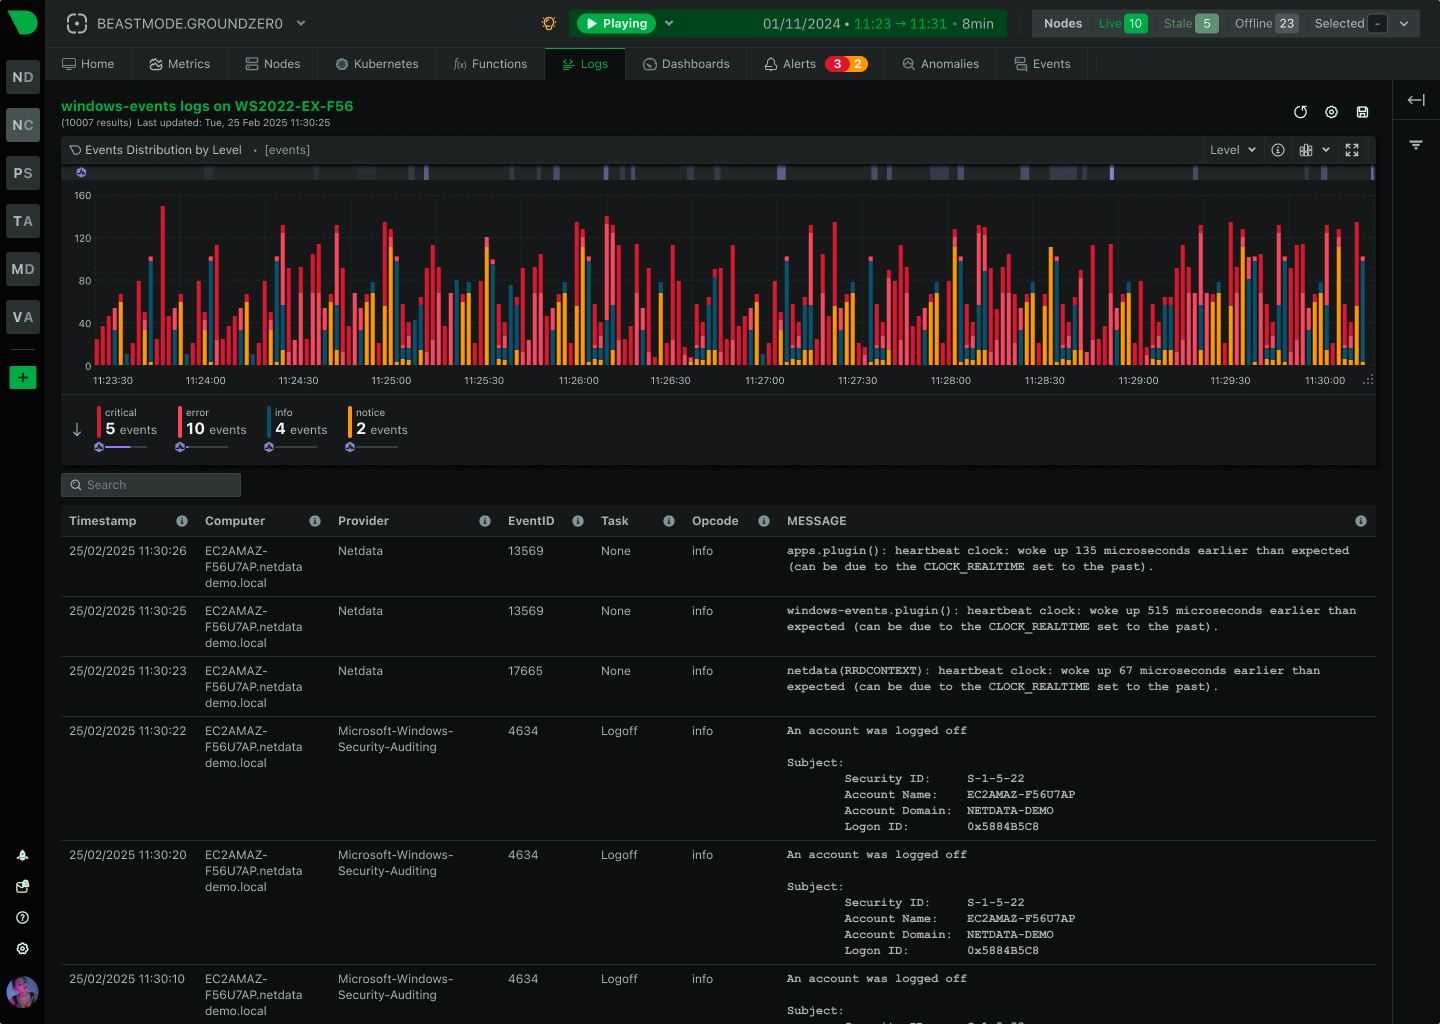
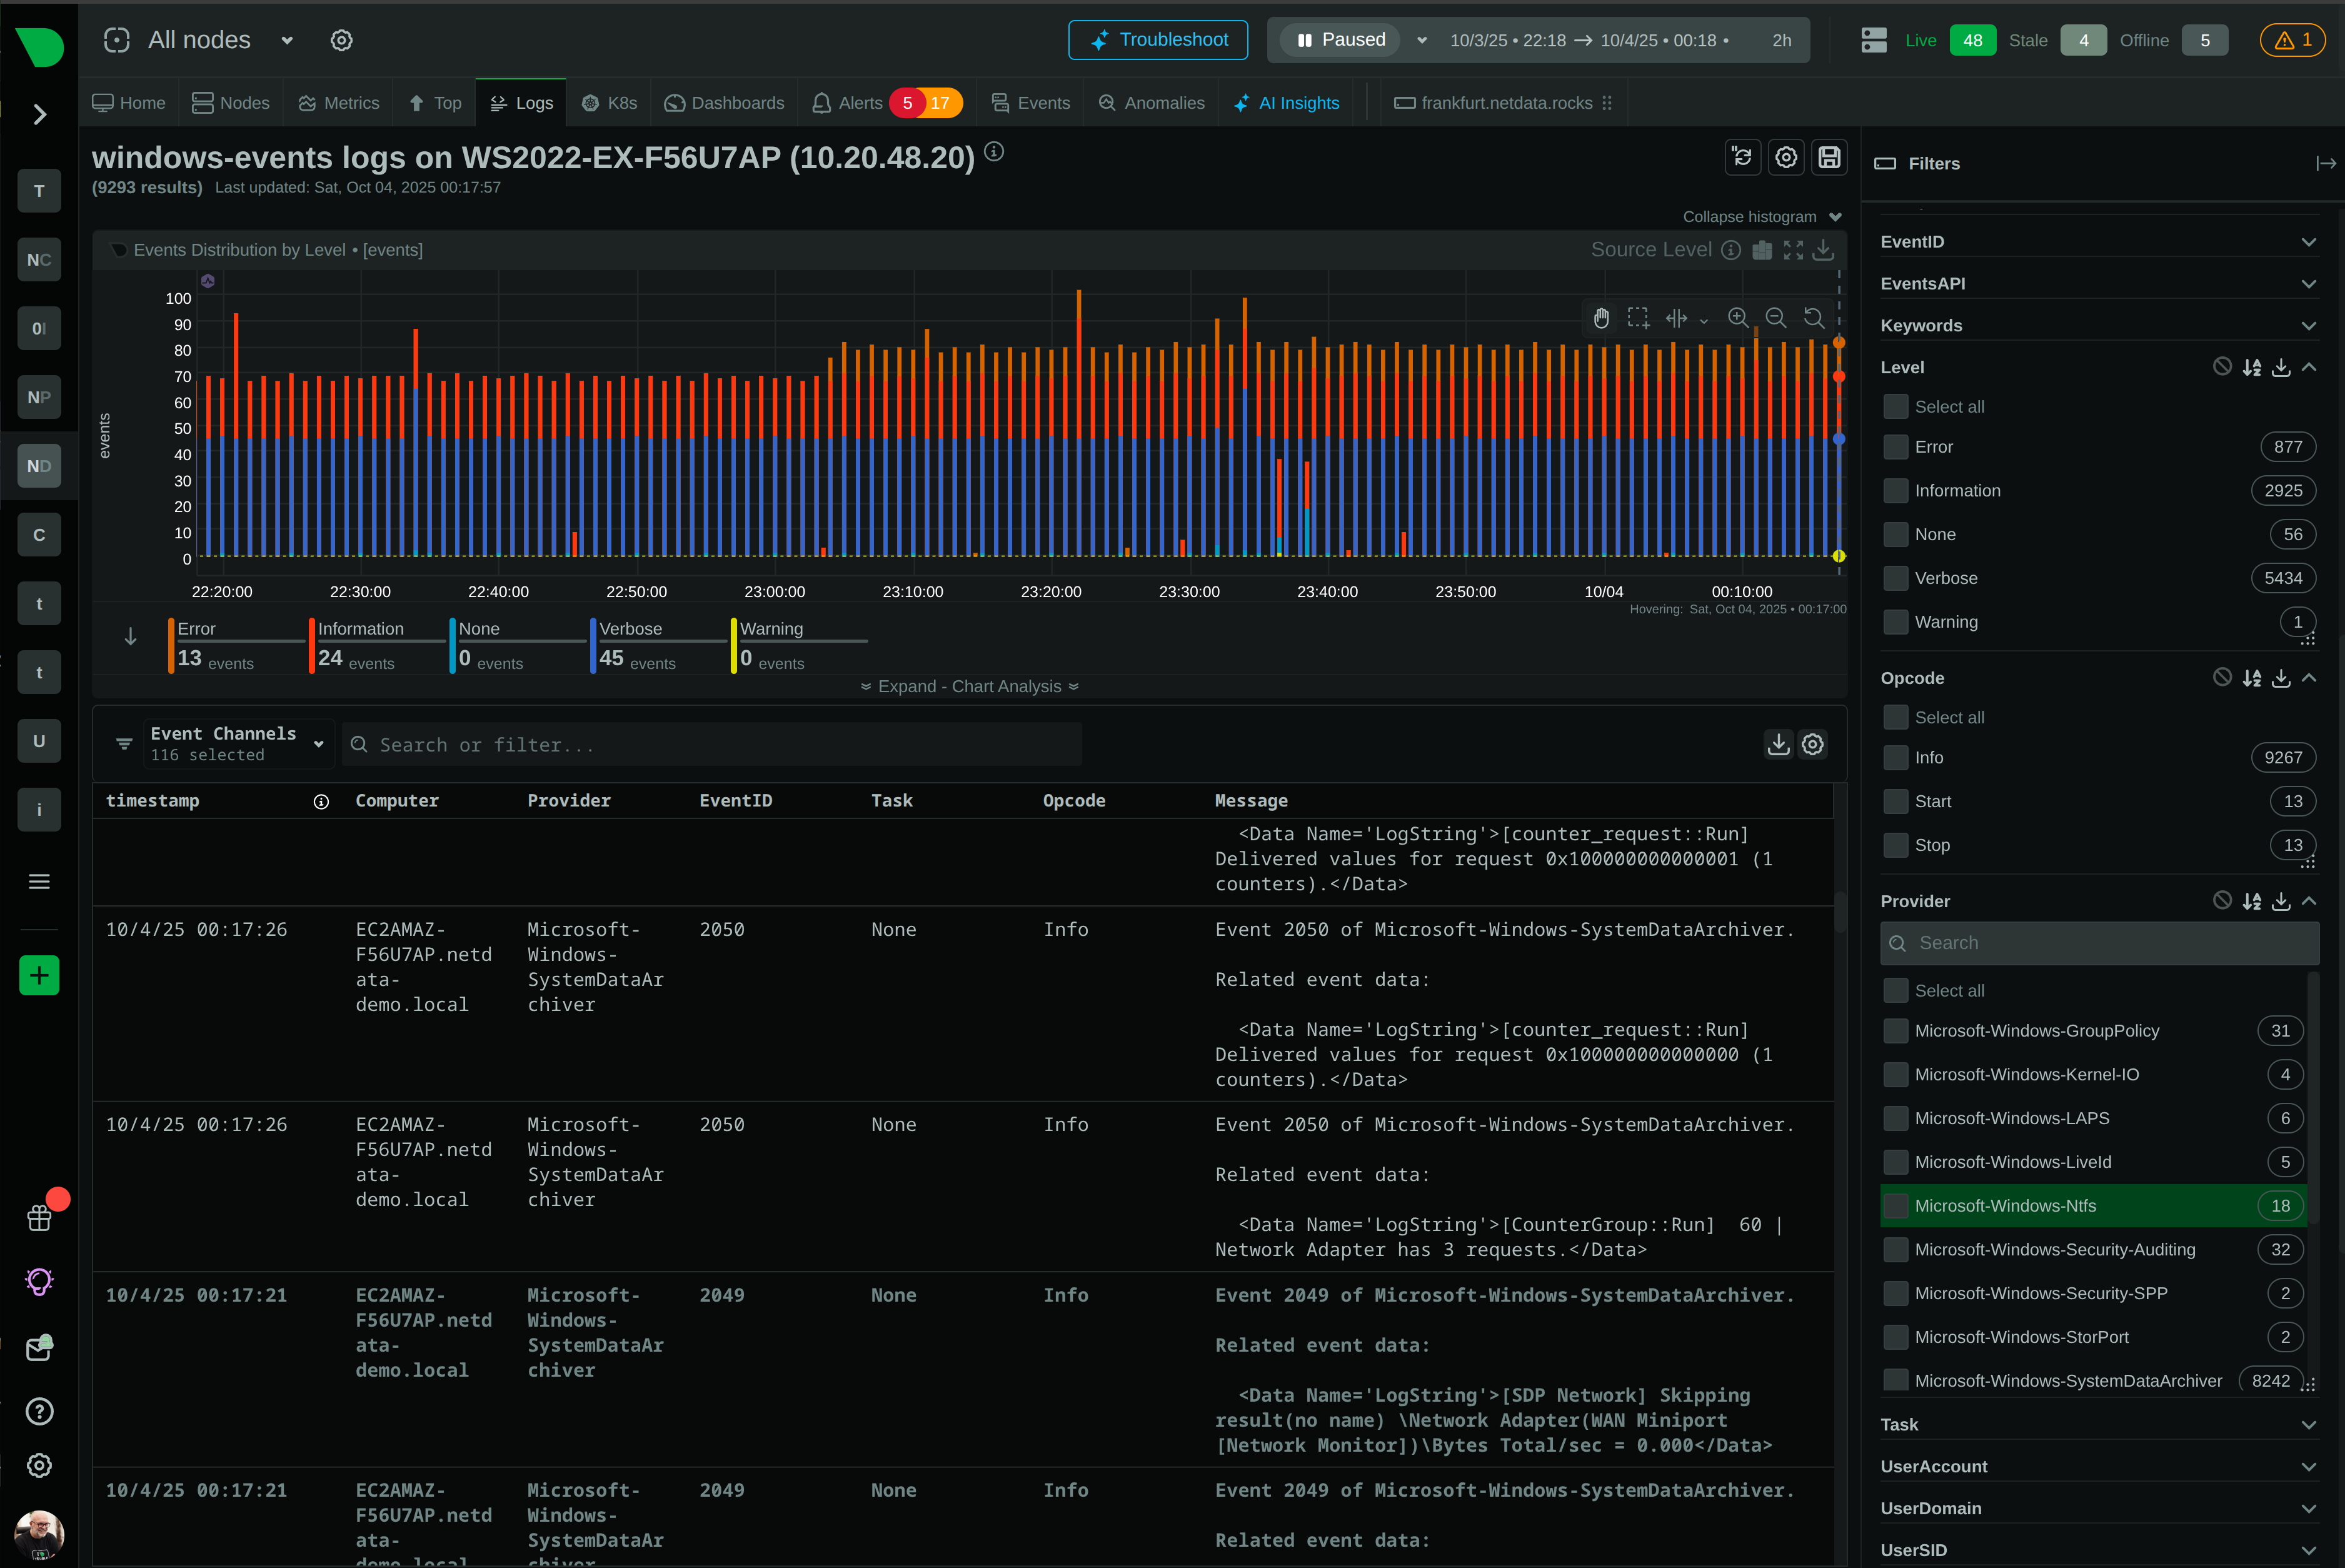
While LibreNMS polls every 5 minutes, Netdata delivers per-second real-time visibility with AI-powered insights. Get complete observability for servers, applications, and Windows systems - capabilities LibreNMS was never designed to provide.

Background Hero

Why Organizations Choose Netdata Over LibreNMS

Six game-changing advantages for modern infrastructure teams

True Real-Time Monitoring

Per-second data collection and visualization vs LibreNMS’s 5-minute polling. Catch transient issues and microbursts that 5-minute averages hide completely.

Native Windows Support

Full WMI instrumentation, Event Logs, IIS, SQL Server, and Active Directory monitoring. LibreNMS only provides basic SNMP stats that often break.

AI Throughout the Platform

18 ML models per metric for anomaly detection, AI Co-Engineer for troubleshooting, automated root cause analysis. LibreNMS has zero AI/ML capabilities.

60-Second Setup

One-line installation with zero configuration vs LibreNMS’s 2-8 hour setup requiring 19+ manual steps and extensive Linux/database expertise.

Linear Scalability

Edge-native architecture scales to 100,000+ nodes without performance degradation. LibreNMS struggles beyond 1,000 devices per poller.

Complete Observability

Unified metrics, logs, alerts, and AI insights for servers, containers, applications, and cloud. LibreNMS focuses only on SNMP network devices.

Trusted by DevOps teams worldwide

Platform Comparison

Netdata vs LibreNMS: Core Capabilities

How the platforms compare across essential monitoring dimensions

Capability

Netdata

LibreNMS

Data Granularity

✅ Per-Second
1-second collection and visualization latency

⚠️ 5-Minute Default
300-second polling interval misses transient issues

Real-Time Latency

✅ Sub-2 Seconds
Event to insight in under 2 seconds

❌ 5+ Minutes
Polling delay plus processing time

Setup Complexity

✅ 60 Seconds
One-line install, zero configuration required

❌ 2-8 Hours
19+ manual steps, extensive expertise needed

Windows Monitoring

✅ Native Support
Full WMI, Event Logs, IIS, SQL Server, AD

❌ Basic SNMP Only
Deprecated agent, often broken, unusable

AI/ML Capabilities

✅ AI Throughout
18 models per metric, AI Co-Engineer, automated RCA

❌ None
Zero AI/ML, manual rule-based alerting only

Scalability

✅ 100,000+ Nodes
Linear edge architecture, proven at scale

⚠️ ~1,000 Per Poller
Complex distributed setup, performance degrades

Resource Efficiency

✅ <5% CPU
150-200 MB RAM per agent, minimal overhead

❌ 60-80% CPU
8-16GB RAM for 1,000 devices centrally

Container Support

✅ Native
Docker, Kubernetes, Podman with cgroups

⚠️ Limited
Basic SNMP monitoring only

Application Monitoring

✅ 800+ Integrations
Native instrumentation, auto-discovery

⚠️ 22 Apps
SNMP extend method, complex setup

Logs Management

✅ Native
systemd-journal, Windows Event Logs, no pipeline

⚠️ Syslog Only
Database storage, aggressive purging needed

SNMP Network Devices

⚠️ Basic
SNMP module available, not primary focus

✅ Advanced
500+ vendors, core strength, auto-discovery

Pricing Model

✅ Predictable
Predictable per node pricing, no data volume charges

✅ Free
GPL v3 open source, infrastructure costs only

Experience the Netdata Advantage

See Problems as They Happen

LibreNMS’s 5-minute polling creates blind spots where critical issues hide. Netdata’s per-second monitoring reveals microbursts, transient spikes, and cascading failures the moment they occur. When a database query spikes to 100% CPU for 3 seconds, LibreNMS shows a harmless 25% average. Netdata shows the actual 100% spike that’s degrading user experience.

300× More Granular

See Real-Time Monitoring

See Problems as They Happen

Monitor Windows Without Compromise

LibreNMS relies on Windows’s deprecated SNMP agent that provides only basic CPU, memory, disk, and network stats - and even those often break. Netdata provides native Windows monitoring with full WMI instrumentation, complete Event Log access, and deep application support for IIS, SQL Server, Active Directory, Hyper-V, and Exchange. Get the same comprehensive visibility on Windows that you expect on Linux.

Full Windows Coverage

Explore Windows Monitoring

Monitor Windows Without Compromise

Let AI Find Problems for You

LibreNMS has zero AI or machine learning capabilities - every alert requires manual threshold configuration and every investigation is manual. Netdata runs 18 unsupervised ML models per metric, achieving 99% false positive reduction through consensus. The Anomaly Advisor automatically correlates issues across thousands of metrics, surfacing root cause in the top 30-50 results. The AI Co-Engineer explains problems in plain language and suggests fixes. Stop manually hunting for needles in haystacks.

80% MTTR Reduction

Discover AI Features

Let AI Find Problems for You

Deploy in Minutes, Not Days

LibreNMS installation requires 19+ manual steps, switching between root and librenms users, configuring MySQL, PHP, web servers, and RRDTool - taking 2-8 hours even for experienced administrators. Netdata installs with a single command in 60 seconds, automatically discovers your infrastructure, generates dashboards, and starts collecting metrics immediately. No database setup, no web server configuration, no PHP version conflicts. Just instant observability.

120-480× Faster Setup

Try Quick Install

Deploy in Minutes, Not Days

Feature Comparison

Monitoring Features Side by Side

Detailed comparison of monitoring capabilities across platforms

Feature

Netdata

LibreNMS

Operating System Monitoring

✅ Comprehensive
Native agents for Linux, Windows, macOS, FreeBSD

⚠️ Basic
SNMP-based, limited depth

Process Monitoring

✅ Per-Process
CPU, memory, I/O, network per process

⚠️ Limited
Via check_mk agent, complex setup

Container Monitoring

✅ Native
Docker, Kubernetes, Podman, LXC with cgroups

⚠️ Basic
Limited SNMP visibility

Kubernetes Monitoring

✅ Full Support
Pods, services, nodes, events, native integration

⚠️ Limited
Basic SNMP monitoring only

Database Monitoring

✅ Native
MySQL, PostgreSQL, MSSQL, Redis, MongoDB, more

⚠️ Basic
SNMP extend method, limited metrics

Web Server Monitoring

✅ Deep Integration
Apache, Nginx, IIS with detailed metrics

⚠️ Basic
SNMP extend, limited visibility

Cloud Monitoring

✅ Native
AWS, Azure, GCP with full integration

⚠️ Limited
Basic cloud device support

Network Device Monitoring

⚠️ Basic
SNMP module available, not primary focus

✅ Advanced
500+ vendors, auto-discovery, core strength

Custom Metrics

✅ Multiple Methods
StatsD, OpenMetrics, Prometheus, OpenTelemetry

⚠️ Complex
SNMP extend method, manual configuration

Synthetic Monitoring

✅ Built-In
HTTP, TCP, DNS checks with history

⚠️ Via Plugins
Nagios plugins integration

Hardware Monitoring

✅ Comprehensive
IPMI, sensors, GPUs, EDAC ECC, PCI AER

✅ Good
SNMP-based sensor monitoring

Log Management

✅ Native
systemd-journal, Windows Events, no pipeline

⚠️ Syslog
Database storage, aggressive purging

View All Integrations

Key Netdata Capabilities

Per-Second Visibility

Netdata collects and visualizes metrics every second with 1-second latency. See problems as they happen, not 5 minutes later when it's too late.

300× more granular than LibreNMS

Learn About Real-Time
Real-Time Dashboard

Use Case Comparison

Netdata vs LibreNMS Use Cases

Which platform fits your monitoring needs

Use Case

Netdata

LibreNMS

Real-Time Infrastructure Monitoring

✅ Ideal
Per-second visibility, instant troubleshooting

❌ Not Real-Time
5-minute polling, delayed insights

Live Troubleshooting

✅ Console Replacement
Browser-based debugging with history and ML

❌ Limited
Static dashboards, manual investigation

Windows Server Monitoring

✅ Native
Full WMI, Event Logs, enterprise apps

❌ Unusable
Basic SNMP only, often broken

Container & Kubernetes

✅ Native
Full cgroups, pod, service monitoring

⚠️ Limited
Basic SNMP visibility only

Application Performance

✅ Comprehensive
800+ integrations, native instrumentation

⚠️ Basic
22 apps via SNMP extend

Cloud Infrastructure

✅ Native
AWS, Azure, GCP full integration

⚠️ Limited
Basic cloud device support

Network Device Monitoring

⚠️ Basic
SNMP module available, not primary focus

✅ Advanced
500+ vendors, auto-discovery, core strength

ISP Bandwidth Billing

❌ Not Available
No built-in billing module

✅ Native
95th percentile, port grouping, invoicing

Capacity Planning

✅ AI-Powered
Predictive analytics, automated forecasting

⚠️ Manual
Historical data review, no predictions

Anomaly Detection

✅ Automatic
18 ML models per metric, 99% false positive reduction

❌ None
Manual rule-based alerting only

Root Cause Analysis

✅ Automated
Anomaly Advisor, AI Co-Engineer, correlations

❌ Manual
Manual investigation required

Multi-Cloud Monitoring

✅ Unified
Single platform across all clouds

⚠️ Limited
Basic support, not optimized

Frequently Asked Questions