The only agent that thinks for itself

Autonomous Monitoring with self-learning AI built-in, operating independently across your entire stack.

Unlimited Metrics & Logs
Machine learning & MCP
5% CPU, 150MB RAM
3GB disk, >1 year retention
800+ integrations, zero config
Dashboards, alerts out of the box
> Discover Netdata Agents
Centralized metrics streaming and storage

Aggregate metrics from multiple agents into centralized Parent nodes for unified monitoring across your infrastructure.

Stream from unlimited agents
Long-term data retention
High availability clustering
Data replication & backup
Scalable architecture
Enterprise-grade security
> Learn about Parents
Fully managed cloud platform

Access your monitoring data from anywhere with our SaaS platform. No infrastructure to manage, automatic updates, and global availability.

Zero infrastructure management
99.9% uptime SLA
Global data centers
Automatic updates & patches
Enterprise SSO & RBAC
SOC2 & ISO certified
> Explore Netdata Cloud
Deploy Netdata Cloud in your infrastructure

Run the full Netdata Cloud platform on-premises for complete data sovereignty and compliance with your security policies.

Complete data sovereignty
Air-gapped deployment
Custom compliance controls
Private network integration
Dedicated support team
Kubernetes & Docker support
> Learn about Cloud On-Premises
Powerful, intuitive monitoring interface

Modern, responsive UI built for real-time troubleshooting with customizable dashboards and advanced visualization capabilities.

Real-time chart updates
Customizable dashboards
Dark & light themes
Advanced filtering & search
Responsive on all devices
Collaboration features
> Explore Netdata UI
Monitor on the go

Native iOS and Android apps bring full monitoring capabilities to your mobile device with real-time alerts and notifications.

iOS & Android apps
Push notifications
Touch-optimized interface
Offline data access
Biometric authentication
Widget support
> Download apps

Best energy efficiency

True real-time per-second

100% automated zero config

Centralized observability

Multi-year retention

High availability built-in

Zero maintenance

Always up-to-date

Enterprise security

Complete data control

Air-gap ready

Compliance certified

Millisecond responsiveness

Infinite zoom & pan

Works on any device

Native performance

Instant alerts

Monitor anywhere

80% Faster Incident Resolution
AI-powered troubleshooting from detection, to root cause and blast radius identification, to reporting.
True Real-Time and Simple, even at Scale
Linearly and infinitely scalable full-stack observability, that can be deployed even mid-crisis.
90% Cost Reduction, Full Fidelity
Instead of centralizing the data, Netdata distributes the code, eliminating pipelines and complexity.
Control Without Surrender
SOC 2 Type 2 certified with every metric kept on your infrastructure.
Integrations

800+ collectors and notification channels, auto-discovered and ready out of the box.

800+ data collectors
Auto-discovery & zero config
Cloud, infra, app protocols
Notifications out of the box
> Explore integrations
Real Results
46% Cost Reduction

Reduced monitoring costs by 46% while cutting staff overhead by 67%.

— Leonardo Antunez, Codyas

Zero Pipeline

No data shipping. No central storage costs. Query at the edge.

From Our Users
"Out-of-the-Box"

So many out-of-the-box features! I mostly don't have to develop anything.

— Simon Beginn, LANCOM Systems

No Query Language

Point-and-click troubleshooting. No PromQL, no LogQL, no learning curve.

Enterprise Ready
67% Less Staff, 46% Cost Cut

Enterprise efficiency without enterprise complexity—real ROI from day one.

— Leonardo Antunez, Codyas

SOC 2 Type 2 Certified

Zero data egress. Only metadata reaches the cloud. Your metrics stay on your infrastructure.

Full Coverage
800+ Collectors

Auto-discovered and configured. No manual setup required.

Any Notification Channel

Slack, PagerDuty, Teams, email, webhooks—all built-in.

Built for the People Who Get Paged
Because 3am alerts deserve instant answers, not hour-long hunts.
Every Industry Has Rules. We Master Them.
See how healthcare, finance, and government teams cut monitoring costs 90% while staying audit-ready.
Monitor Any Technology. Configure Nothing.
Install the agent. It already knows your stack.
From Our Users
"A Rare Unicorn"

Netdata gives more than you invest in it. A rare unicorn that obeys the Pareto rule.

— Eduard Porquet Mateu, TMB Barcelona

99% Downtime Reduction

Reduced website downtime by 99% and cloud bill by 30% using Netdata alerts.

— Falkland Islands Government

Real Savings
30% Cloud Cost Reduction

Optimized resource allocation based on Netdata alerts cut cloud spending by 30%.

— Falkland Islands Government

46% Cost Cut

Reduced monitoring staff by 67% while cutting operational costs by 46%.

— Codyas

Real Coverage
"Plugin for Everything"

Netdata has agent capacity or a plugin for everything, including Windows and Kubernetes.

— Eduard Porquet Mateu, TMB Barcelona

"Out-of-the-Box"

So many out-of-the-box features! I mostly don't have to develop anything.

— Simon Beginn, LANCOM Systems

Real Speed
Troubleshooting in 30 Seconds

From 2-3 minutes to 30 seconds—instant visibility into any node issue.

— Matthew Artist, Nodecraft

20% Downtime Reduction

20% less downtime and 40% budget optimization from out-of-the-box monitoring.

— Simon Beginn, LANCOM Systems

Pay per Node. Unlimited Everything Else.

One price per node. Unlimited metrics, logs, users, and retention. No per-GB surprises.

Free tier—forever
No metric limits or caps
Retention you control
Cancel anytime
> See pricing plans
What's Your Monitoring Really Costing You?

Most teams overpay by 40-60%. Let's find out why.

Expose hidden metric charges
Calculate tool consolidation
Customers report 30-67% savings
Results in under 60 seconds
> See what you're really paying
Your Infrastructure Is Unique. Let's Talk.

Because monitoring 10 nodes is different from monitoring 10,000.

On-prem & air-gapped deployment
Volume pricing & agreements
Architecture review for your scale
Compliance & security support
> Start a conversation
Monitoring That Sells Itself

Deploy in minutes. Impress clients in hours. Earn recurring revenue for years.

30-second live demos close deals
Zero config = zero support burden
Competitive margins & deal protection
Response in 48 hours
> Apply to partner
Per-Second Metrics at Homelab Prices

Same engine, same dashboards, same ML. Just priced for tinkerers.

Community: Free forever · 5 nodes · non-commercial
Homelab: $90/yr · unlimited nodes · fair usage
> Start monitoring your lab—free
$1,000 Per Referral. Unlimited Referrals.

Your colleagues get 10% off. You get 10% commission. Everyone wins.

10% of subscriptions, up to $1,000 each
Track earnings inside Netdata Cloud
PayPal/Venmo payouts in 3-4 weeks
No caps, no complexity
> Get your referral link
Cost Proof
40% Budget Optimization

"Netdata's significant positive impact" — LANCOM Systems

Calculate Your Savings

Compare vs Datadog, Grafana, Dynatrace

Savings Proof
46% Cost Reduction

"Cut costs by 46%, staff by 67%" — Codyas

30% Cloud Bill Savings

"Reduced cloud bill by 30%" — Falkland Islands Gov

Enterprise Proof
"Better Than Combined Alternatives"

"Better observability with Netdata than combining other tools." — TMB Barcelona

Real Engineers, <24h Response

DPA, SLAs, on-prem, volume pricing

Why Partners Win
Demo Live Infrastructure

One command, 30 seconds, real data—no sandbox needed

Zero Tickets, High Margins

Auto-config + per-node pricing = predictable profit

Homelab Ready
"Absolutely Incredible"

"We tested every monitoring system under the sun." — Benjamin Gabler, CEO Rocket.Net

76k+ GitHub Stars

3rd most starred monitoring project

Worth Recommending
Product That Delivers

Customers report 40-67% cost cuts, 99% downtime reduction

Zero Risk to Your Rep

Free tier lets them try before they buy

Never Fight Fires Alone

Docs, community, and expert help—pick your path to resolution.

Learn.netdata.cloud docs
Discord, Forums, GitHub
Premium support available
> Get answers now
60 Seconds to First Dashboard

One command to install. Zero config. 850+ integrations documented.

Linux, Windows, K8s, Docker
Auto-discovers your stack
> Read our documentation
See Netdata in Action

Watch real-time monitoring in action—demos, tutorials, and engineering deep dives.

Product demos and walkthroughs
Real infrastructure, not staged
> Start with the 3-minute tour
Level Up Your Monitoring
Real problems. Real solutions. 112+ guides from basic monitoring to AI observability.
76,000+ Engineers Strong
615+ contributors. 1.5M daily downloads. One mission: simplify observability.
Per-Second. 90% Cheaper. Data Stays Home.
Side-by-side comparisons: costs, real-time granularity, and data sovereignty for every major tool.

See why teams switch from Datadog, Prometheus, Grafana, and more.

> Browse all comparisons
Edge-Native Observability, Born Open Source
Per-second visibility, ML on every metric, and data that never leaves your infrastructure.
Founded in 2016
615+ contributors worldwide
Remote-first, engineering-driven
Open source first
> Read our story
Promises We Publish—and Prove
12 principles backed by open code, independent validation, and measurable outcomes.
Open source, peer-reviewed
Zero config, instant value
Data sovereignty by design
Aligned pricing, no surprises
> See all 12 principles
Edge-Native, AI-Ready, 100% Open
76k+ stars. Full ML, AI, and automation—GPLv3+, not premium add-ons.
76,000+ GitHub stars
GPLv3+ licensed forever
ML on every metric, included
Zero vendor lock-in
> Explore our open source
Build Real-Time Observability for the World
Remote-first team shipping per-second monitoring with ML on every metric.
Remote-first, fully distributed
Open source (76k+ stars)
Challenging technical problems
Your code on millions of systems
> See open roles
Talk to a Netdata Human in <24 Hours
Sales, partnerships, press, or professional services—real engineers, fast answers.
Discuss your observability needs
Pricing and volume discounts
Partnership opportunities
Media and press inquiries
> Book a conversation
Your Data. Your Rules.
On-prem data, cloud control plane, transparent terms.
Trust & Scale
76,000+ GitHub Stars

One of the most popular open-source monitoring projects

SOC 2 Type 2 Certified

Enterprise-grade security and compliance

Data Sovereignty

Your metrics stay on your infrastructure

Validated
University of Amsterdam

"Most energy-efficient monitoring solution" — ICSOC 2023, peer-reviewed

ADASTEC (Autonomous Driving)

"Doesn't miss alerts—mission-critical trust for safety software"

Community Stats
615+ Contributors

Global community improving monitoring for everyone

1.5M+ Downloads/Day

Trusted by teams worldwide

GPLv3+ Licensed

Free forever, fully open source agent

Why Join?
Remote-First

Work from anywhere, async-friendly culture

Impact at Scale

Your work helps millions of systems

Compliance
SOC 2 Type 2

Audited security controls

GDPR Ready

Data stays on your infrastructure

Netdata vs ManageEngine

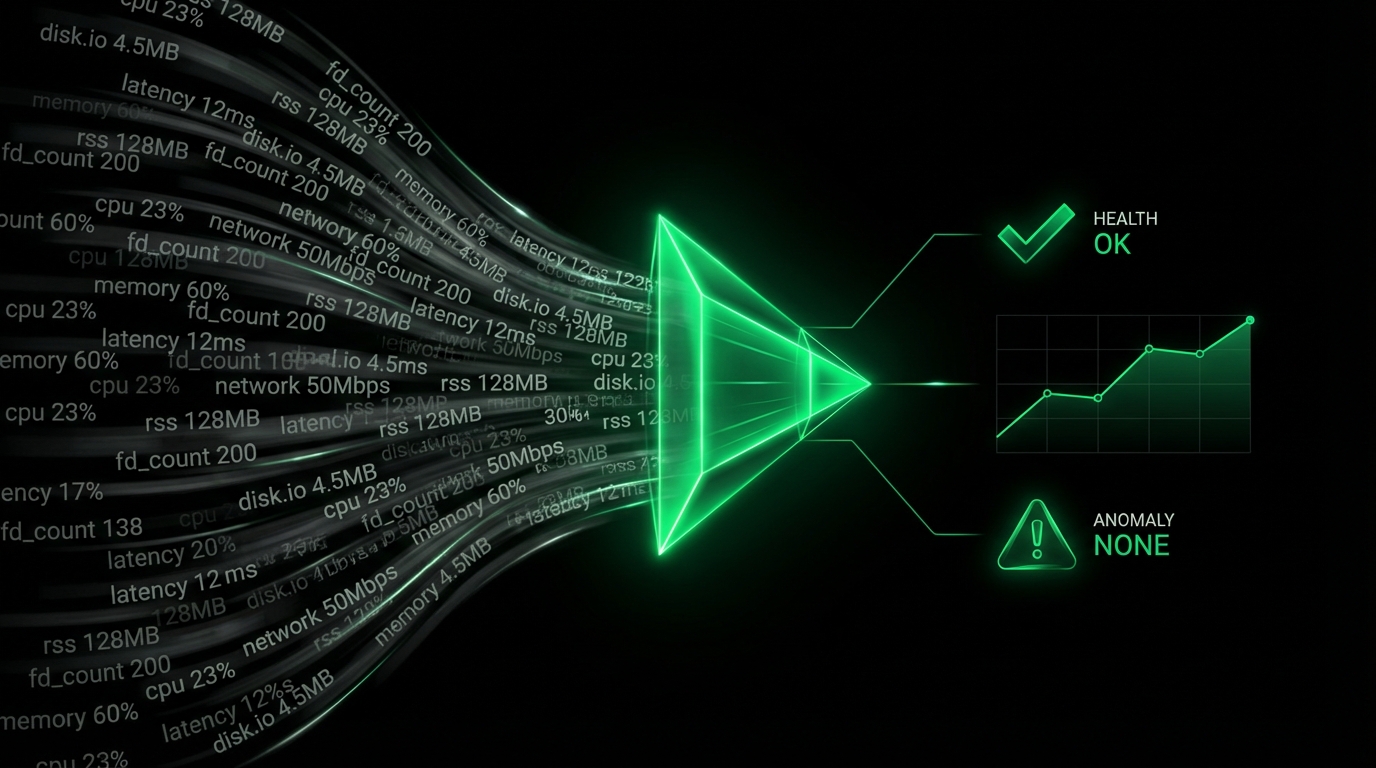
See Every Second of Your Infrastructure

ManageEngine monitors every 1-5 minutes. Netdata captures every second. When containers live for seconds and incidents cascade in moments, you can’t afford to be blind for five minutes. Experience true real-time observability with per-second granularity, distributed intelligence, and zero configuration - at 90% lower cost.

Background Hero

Why Modern Teams Choose Netdata

Built for cloud-native infrastructure and DevOps velocity

True Real-Time Visibility

Per-second data collection and visualization. Catch transient issues that 5-minute polling misses completely.

Deploy in 60 Seconds

Zero configuration required. Auto-discovers infrastructure, generates dashboards, trains ML models automatically.

ML on Every Metric

18 unsupervised models per metric detect anomalies with 99% false positive reduction. No manual tuning needed.

Edge-Native Architecture

Distributed intelligence scales linearly. Add 1,000 nodes with same performance as your first 10.

90% Cost Reduction

Transparent per-node pricing. Unlimited metrics, logs, and users. No surprise bills or annual increases.

AI-Powered Troubleshooting

Root cause analysis in minutes. AI explains issues in plain language, surfaces top 30-50 relevant metrics automatically.

Trusted by operations teams worldwide

Platform Comparison

Netdata vs ManageEngine

How the platforms compare for modern infrastructure monitoring

Capability

Netdata

ManageEngine

Data Granularity

✅ 1 second
True real-time collection and visualization

⚠️ 1-5 minutes
Misses 90% of transient issues

Visualization Latency

✅ 1 second
Sub-2-second event to insight

⚠️ Minutes
Delayed visibility during incidents

Setup Complexity

✅ 60 seconds
Zero configuration, auto-discovery

❌ Days to weeks
Extensive manual configuration required

Scalability Model

✅ Linear
Distributed edge architecture, no bottleneck

⚠️ Centralized
Database bottlenecks at scale

Agent Overhead

✅ <5% CPU, 150-200MB RAM
Independently validated most efficient

❌ 5-20% CPU, variable
6+ years of unresolved overhead issues

ML Anomaly Detection

✅ All metrics automatically
18 models per metric, zero tuning

⚠️ Limited, manual config
Selective metrics only

Data Sovereignty

✅ Edge/on-premises
Complete control, compliance by design

⚠️ Mixed
Some products cloud-only

Storage Efficiency

✅ 0.6 bytes/sample
Years of data in gigabytes

⚠️ Not disclosed
Database overhead significant

Pricing Model

✅ Per-node, transparent
Unlimited metrics, users, logs

❌ Complex, add-ons
Annual increases, hidden costs

Customer Support

✅ Community + Enterprise
Active community, 24/7 for Enterprise

❌ 3-5 day responses
20+ years of documented issues

Open Source

✅ GPLv3+ Agent
No vendor lock-in, full transparency

❌ Proprietary
Closed source, vendor dependency

Focus

✅ Modern observability
Cloud-native, DevOps, real-time

⚠️ Traditional IT suite
ITSM, endpoints, legacy focus

Transform Your Operations

Catch Problems Before They Cascade

Per-second monitoring reveals the 3-second CPU spike that triggers a 30-second outage. ManageEngine’s 5-minute polling shows you a harmless average after the damage is done. See actual behavior, not statistical approximations.

80% MTTR Reduction

See Real-Time Monitoring

Catch Problems Before They Cascade

Deploy Monitoring in Minutes, Not Months

ManageEngine requires days of configuration, manual device addition, and dashboard building. Netdata auto-discovers your infrastructure, generates dashboards algorithmically, and trains ML models automatically. From install to full visibility in 60 seconds.

60 Seconds to Full Monitoring

Experience Zero-Config

Deploy Monitoring in Minutes, Not Months

Scale Without Architectural Rewrites

ManageEngine’s centralized architecture creates database bottlenecks, console slowdowns, and deployment failures at scale. Netdata’s distributed edge-native design scales linearly - your 1,000th node performs identically to your first. No central bottleneck, no single point of failure.

100,000+ Nodes Proven

Understand Edge Architecture

Scale Without Architectural Rewrites

Anomaly Detection on Every Metric

Netdata trains 18 unsupervised ML models per metric automatically, requiring unanimous consensus before flagging anomalies. This achieves 99% false positive reduction in anomaly detection - surfacing unusual patterns without manual threshold configuration. Combined with 400+ component-level alerts, you get comprehensive coverage with actionable signals.

18 ML Models Per Metric

Explore ML Capabilities

Anomaly Detection on Every Metric

Reduce Costs by 90% Without Compromise

ManageEngine’s complex pricing - multiple products, add-on costs, annual increases - creates budget uncertainty. Netdata’s transparent per-node pricing includes unlimited metrics, logs, users, and all features. No surprise bills, no forced upgrades, no vendor lock-in.

90% Cost Savings

See Transparent Pricing

Reduce Costs by 90% Without Compromise

Feature Comparison

Monitoring Features Side by Side

Comprehensive feature comparison for infrastructure observability

Feature

Netdata

ManageEngine

System Monitoring

✅ Per-second
CPU, memory, disk, network - complete coverage

✅ 1-5 minutes
Basic system metrics

Container Monitoring

✅ Native, ephemeral
Docker, Kubernetes, auto-discovery

⚠️ Via agents
Limited ephemeral support

Cloud Monitoring

✅ AWS, Azure, GCP
Native integrations, per-second

✅ AWS, Azure, GCP
Standard cloud support

Application Monitoring

✅ 800+ integrations
Auto-discovery, zero config

✅ 150+ technologies
Manual configuration required

Database Monitoring

✅ Major databases
MySQL, PostgreSQL, MongoDB, etc.

✅ Major databases
Similar coverage

Network Monitoring

✅ Connections, bandwidth
Per-second, per-process visibility

✅ Advanced NetFlow/SNMP
Deeper network focus

Logs Management

✅ Zero pipeline
Direct journal access, 90% cost reduction

⚠️ Log360 SIEM
6K-10K daily false positives reported

Kubernetes Monitoring

✅ Native, multi-cluster
Pods, services, nodes - auto-discovered

⚠️ Basic support
Limited cloud-native features

Custom Metrics

✅ Unlimited, included
StatsD, OpenMetrics, OpenTelemetry

❌ Extra cost
APM add-ons require additional fees

Synthetic Monitoring

✅ Via plugins
HTTP, TCP, DNS checks

✅ Native Site24x7
130+ global locations

SNMP Monitoring

✅ Good coverage
Network devices, auto-discovery

✅ Advanced
200+ vendors, MIB browser

Distributed Tracing

⚠️ Q2 2026
OpenTelemetry traces on roadmap

⚠️ Limited
Basic distributed tracing

View All Integrations

Key Capabilities That Set Netdata Apart

True Per-Second Monitoring

ManageEngine polls every 1-5 minutes. Netdata captures every second. When a container lives for 30 seconds or a CPU spike lasts 3 seconds, minute-based monitoring is blind.

10-60× faster than traditional monitoring

Learn About Real-Time
Real-Time Dashboard

Use Case Comparison

Netdata vs ManageEngine Use Cases

How each platform serves different operational needs

Use Case

Netdata

ManageEngine

Real-Time Infrastructure Monitoring

✅ Ideal
Per-second visibility, purpose-built

⚠️ Basic
1-5 minute polling inadequate

Live Troubleshooting

✅ Ideal
Console replacement, SSH-free debugging

⚠️ Limited
Still requires SSH for many tasks

Cloud-Native Monitoring

✅ Ideal
Kubernetes, containers, ephemeral workloads

⚠️ Basic
Legacy architecture, limited cloud-native

Capacity Planning

✅ Advanced
ML forecasting, years of per-second data

✅ Good
Standard capacity planning features

Application Performance Monitoring

✅ Good
800+ integrations, limited tracing

✅ Good
150+ technologies, APM add-ons

Network Device Monitoring

✅ Good
SNMP, auto-discovery

✅ Advanced
200+ vendors, deep network focus

ITSM/Service Desk

❌ Not Available
Integrates with ServiceNow, Jira

✅ Advanced
ServiceDesk Plus, full ITSM suite

Endpoint Management

❌ Not Available
Focus on observability only

✅ Advanced
Endpoint Central, patch management

Security Monitoring (SIEM)

⚠️ Basic
Infrastructure logs, integrates with SIEMs

⚠️ Limited
Log360 with 6K-10K daily false positives

MSP Multi-Tenancy

✅ Good
Spaces for multi-tenancy

✅ Advanced
MSP Central, purpose-built

Compliance Monitoring

✅ Advanced
Data sovereignty, SOC 2 Type 2

✅ Good
Compliance features available

DevOps/SRE Operations

✅ Ideal
Built for modern DevOps workflows

⚠️ Basic
Traditional IT focus

Frequently Asked Questions