The only agent that thinks for itself

Autonomous Monitoring with self-learning AI built-in, operating independently across your entire stack.

Unlimited Metrics & Logs
Machine learning & MCP
5% CPU, 150MB RAM
3GB disk, >1 year retention
800+ integrations, zero config
Dashboards, alerts out of the box
> Discover Netdata Agents
Centralized metrics streaming and storage

Aggregate metrics from multiple agents into centralized Parent nodes for unified monitoring across your infrastructure.

Stream from unlimited agents
Long-term data retention
High availability clustering
Data replication & backup
Scalable architecture
Enterprise-grade security
> Learn about Parents
Fully managed cloud platform

Access your monitoring data from anywhere with our SaaS platform. No infrastructure to manage, automatic updates, and global availability.

Zero infrastructure management
99.9% uptime SLA
Global data centers
Automatic updates & patches
Enterprise SSO & RBAC
SOC2 & ISO certified
> Explore Netdata Cloud
Deploy Netdata Cloud in your infrastructure

Run the full Netdata Cloud platform on-premises for complete data sovereignty and compliance with your security policies.

Complete data sovereignty
Air-gapped deployment
Custom compliance controls
Private network integration
Dedicated support team
Kubernetes & Docker support
> Learn about Cloud On-Premises
Powerful, intuitive monitoring interface

Modern, responsive UI built for real-time troubleshooting with customizable dashboards and advanced visualization capabilities.

Real-time chart updates
Customizable dashboards
Dark & light themes
Advanced filtering & search
Responsive on all devices
Collaboration features
> Explore Netdata UI
Monitor on the go

Native iOS and Android apps bring full monitoring capabilities to your mobile device with real-time alerts and notifications.

iOS & Android apps
Push notifications
Touch-optimized interface
Offline data access
Biometric authentication
Widget support
> Download apps

Best energy efficiency

True real-time per-second

100% automated zero config

Centralized observability

Multi-year retention

High availability built-in

Zero maintenance

Always up-to-date

Enterprise security

Complete data control

Air-gap ready

Compliance certified

Millisecond responsiveness

Infinite zoom & pan

Works on any device

Native performance

Instant alerts

Monitor anywhere

80% Faster Incident Resolution
AI-powered troubleshooting from detection, to root cause and blast radius identification, to reporting.
True Real-Time and Simple, even at Scale
Linearly and infinitely scalable full-stack observability, that can be deployed even mid-crisis.
90% Cost Reduction, Full Fidelity
Instead of centralizing the data, Netdata distributes the code, eliminating pipelines and complexity.
Control Without Surrender
SOC 2 Type 2 certified with every metric kept on your infrastructure.
Integrations

800+ collectors and notification channels, auto-discovered and ready out of the box.

800+ data collectors
Auto-discovery & zero config
Cloud, infra, app protocols
Notifications out of the box
> Explore integrations
Real Results
46% Cost Reduction

Reduced monitoring costs by 46% while cutting staff overhead by 67%.

— Leonardo Antunez, Codyas

Zero Pipeline

No data shipping. No central storage costs. Query at the edge.

From Our Users
"Out-of-the-Box"

So many out-of-the-box features! I mostly don't have to develop anything.

— Simon Beginn, LANCOM Systems

No Query Language

Point-and-click troubleshooting. No PromQL, no LogQL, no learning curve.

Enterprise Ready
67% Less Staff, 46% Cost Cut

Enterprise efficiency without enterprise complexity—real ROI from day one.

— Leonardo Antunez, Codyas

SOC 2 Type 2 Certified

Zero data egress. Only metadata reaches the cloud. Your metrics stay on your infrastructure.

Full Coverage
800+ Collectors

Auto-discovered and configured. No manual setup required.

Any Notification Channel

Slack, PagerDuty, Teams, email, webhooks—all built-in.

Built for the People Who Get Paged
Because 3am alerts deserve instant answers, not hour-long hunts.
Every Industry Has Rules. We Master Them.
See how healthcare, finance, and government teams cut monitoring costs 90% while staying audit-ready.
Monitor Any Technology. Configure Nothing.
Install the agent. It already knows your stack.
From Our Users
"A Rare Unicorn"

Netdata gives more than you invest in it. A rare unicorn that obeys the Pareto rule.

— Eduard Porquet Mateu, TMB Barcelona

99% Downtime Reduction

Reduced website downtime by 99% and cloud bill by 30% using Netdata alerts.

— Falkland Islands Government

Real Savings
30% Cloud Cost Reduction

Optimized resource allocation based on Netdata alerts cut cloud spending by 30%.

— Falkland Islands Government

46% Cost Cut

Reduced monitoring staff by 67% while cutting operational costs by 46%.

— Codyas

Real Coverage
"Plugin for Everything"

Netdata has agent capacity or a plugin for everything, including Windows and Kubernetes.

— Eduard Porquet Mateu, TMB Barcelona

"Out-of-the-Box"

So many out-of-the-box features! I mostly don't have to develop anything.

— Simon Beginn, LANCOM Systems

Real Speed
Troubleshooting in 30 Seconds

From 2-3 minutes to 30 seconds—instant visibility into any node issue.

— Matthew Artist, Nodecraft

20% Downtime Reduction

20% less downtime and 40% budget optimization from out-of-the-box monitoring.

— Simon Beginn, LANCOM Systems

Pay per Node. Unlimited Everything Else.

One price per node. Unlimited metrics, logs, users, and retention. No per-GB surprises.

Free tier—forever
No metric limits or caps
Retention you control
Cancel anytime
> See pricing plans
What's Your Monitoring Really Costing You?

Most teams overpay by 40-60%. Let's find out why.

Expose hidden metric charges
Calculate tool consolidation
Customers report 30-67% savings
Results in under 60 seconds
> See what you're really paying
Your Infrastructure Is Unique. Let's Talk.

Because monitoring 10 nodes is different from monitoring 10,000.

On-prem & air-gapped deployment
Volume pricing & agreements
Architecture review for your scale
Compliance & security support
> Start a conversation
Monitoring That Sells Itself

Deploy in minutes. Impress clients in hours. Earn recurring revenue for years.

30-second live demos close deals
Zero config = zero support burden
Competitive margins & deal protection
Response in 48 hours
> Apply to partner
Per-Second Metrics at Homelab Prices

Same engine, same dashboards, same ML. Just priced for tinkerers.

Community: Free forever · 5 nodes · non-commercial
Homelab: $90/yr · unlimited nodes · fair usage
> Start monitoring your lab—free
$1,000 Per Referral. Unlimited Referrals.

Your colleagues get 10% off. You get 10% commission. Everyone wins.

10% of subscriptions, up to $1,000 each
Track earnings inside Netdata Cloud
PayPal/Venmo payouts in 3-4 weeks
No caps, no complexity
> Get your referral link
Cost Proof
40% Budget Optimization

"Netdata's significant positive impact" — LANCOM Systems

Calculate Your Savings

Compare vs Datadog, Grafana, Dynatrace

Savings Proof
46% Cost Reduction

"Cut costs by 46%, staff by 67%" — Codyas

30% Cloud Bill Savings

"Reduced cloud bill by 30%" — Falkland Islands Gov

Enterprise Proof
"Better Than Combined Alternatives"

"Better observability with Netdata than combining other tools." — TMB Barcelona

Real Engineers, <24h Response

DPA, SLAs, on-prem, volume pricing

Why Partners Win
Demo Live Infrastructure

One command, 30 seconds, real data—no sandbox needed

Zero Tickets, High Margins

Auto-config + per-node pricing = predictable profit

Homelab Ready
"Absolutely Incredible"

"We tested every monitoring system under the sun." — Benjamin Gabler, CEO Rocket.Net

76k+ GitHub Stars

3rd most starred monitoring project

Worth Recommending
Product That Delivers

Customers report 40-67% cost cuts, 99% downtime reduction

Zero Risk to Your Rep

Free tier lets them try before they buy

Never Fight Fires Alone

Docs, community, and expert help—pick your path to resolution.

Learn.netdata.cloud docs
Discord, Forums, GitHub
Premium support available
> Get answers now
60 Seconds to First Dashboard

One command to install. Zero config. 850+ integrations documented.

Linux, Windows, K8s, Docker
Auto-discovers your stack
> Read our documentation
See Netdata in Action

Watch real-time monitoring in action—demos, tutorials, and engineering deep dives.

Product demos and walkthroughs
Real infrastructure, not staged
> Start with the 3-minute tour
Level Up Your Monitoring
Real problems. Real solutions. 112+ guides from basic monitoring to AI observability.
76,000+ Engineers Strong
615+ contributors. 1.5M daily downloads. One mission: simplify observability.
Per-Second. 90% Cheaper. Data Stays Home.
Side-by-side comparisons: costs, real-time granularity, and data sovereignty for every major tool.

See why teams switch from Datadog, Prometheus, Grafana, and more.

> Browse all comparisons
Edge-Native Observability, Born Open Source
Per-second visibility, ML on every metric, and data that never leaves your infrastructure.
Founded in 2016
615+ contributors worldwide
Remote-first, engineering-driven
Open source first
> Read our story
Promises We Publish—and Prove
12 principles backed by open code, independent validation, and measurable outcomes.
Open source, peer-reviewed
Zero config, instant value
Data sovereignty by design
Aligned pricing, no surprises
> See all 12 principles
Edge-Native, AI-Ready, 100% Open
76k+ stars. Full ML, AI, and automation—GPLv3+, not premium add-ons.
76,000+ GitHub stars
GPLv3+ licensed forever
ML on every metric, included
Zero vendor lock-in
> Explore our open source
Build Real-Time Observability for the World
Remote-first team shipping per-second monitoring with ML on every metric.
Remote-first, fully distributed
Open source (76k+ stars)
Challenging technical problems
Your code on millions of systems
> See open roles
Talk to a Netdata Human in <24 Hours
Sales, partnerships, press, or professional services—real engineers, fast answers.
Discuss your observability needs
Pricing and volume discounts
Partnership opportunities
Media and press inquiries
> Book a conversation
Your Data. Your Rules.
On-prem data, cloud control plane, transparent terms.
Trust & Scale
76,000+ GitHub Stars

One of the most popular open-source monitoring projects

SOC 2 Type 2 Certified

Enterprise-grade security and compliance

Data Sovereignty

Your metrics stay on your infrastructure

Validated
University of Amsterdam

"Most energy-efficient monitoring solution" — ICSOC 2023, peer-reviewed

ADASTEC (Autonomous Driving)

"Doesn't miss alerts—mission-critical trust for safety software"

Community Stats
615+ Contributors

Global community improving monitoring for everyone

1.5M+ Downloads/Day

Trusted by teams worldwide

GPLv3+ Licensed

Free forever, fully open source agent

Why Join?
Remote-First

Work from anywhere, async-friendly culture

Impact at Scale

Your work helps millions of systems

Compliance
SOC 2 Type 2

Audited security controls

GDPR Ready

Data stays on your infrastructure

Modern Observability for Operations Teams

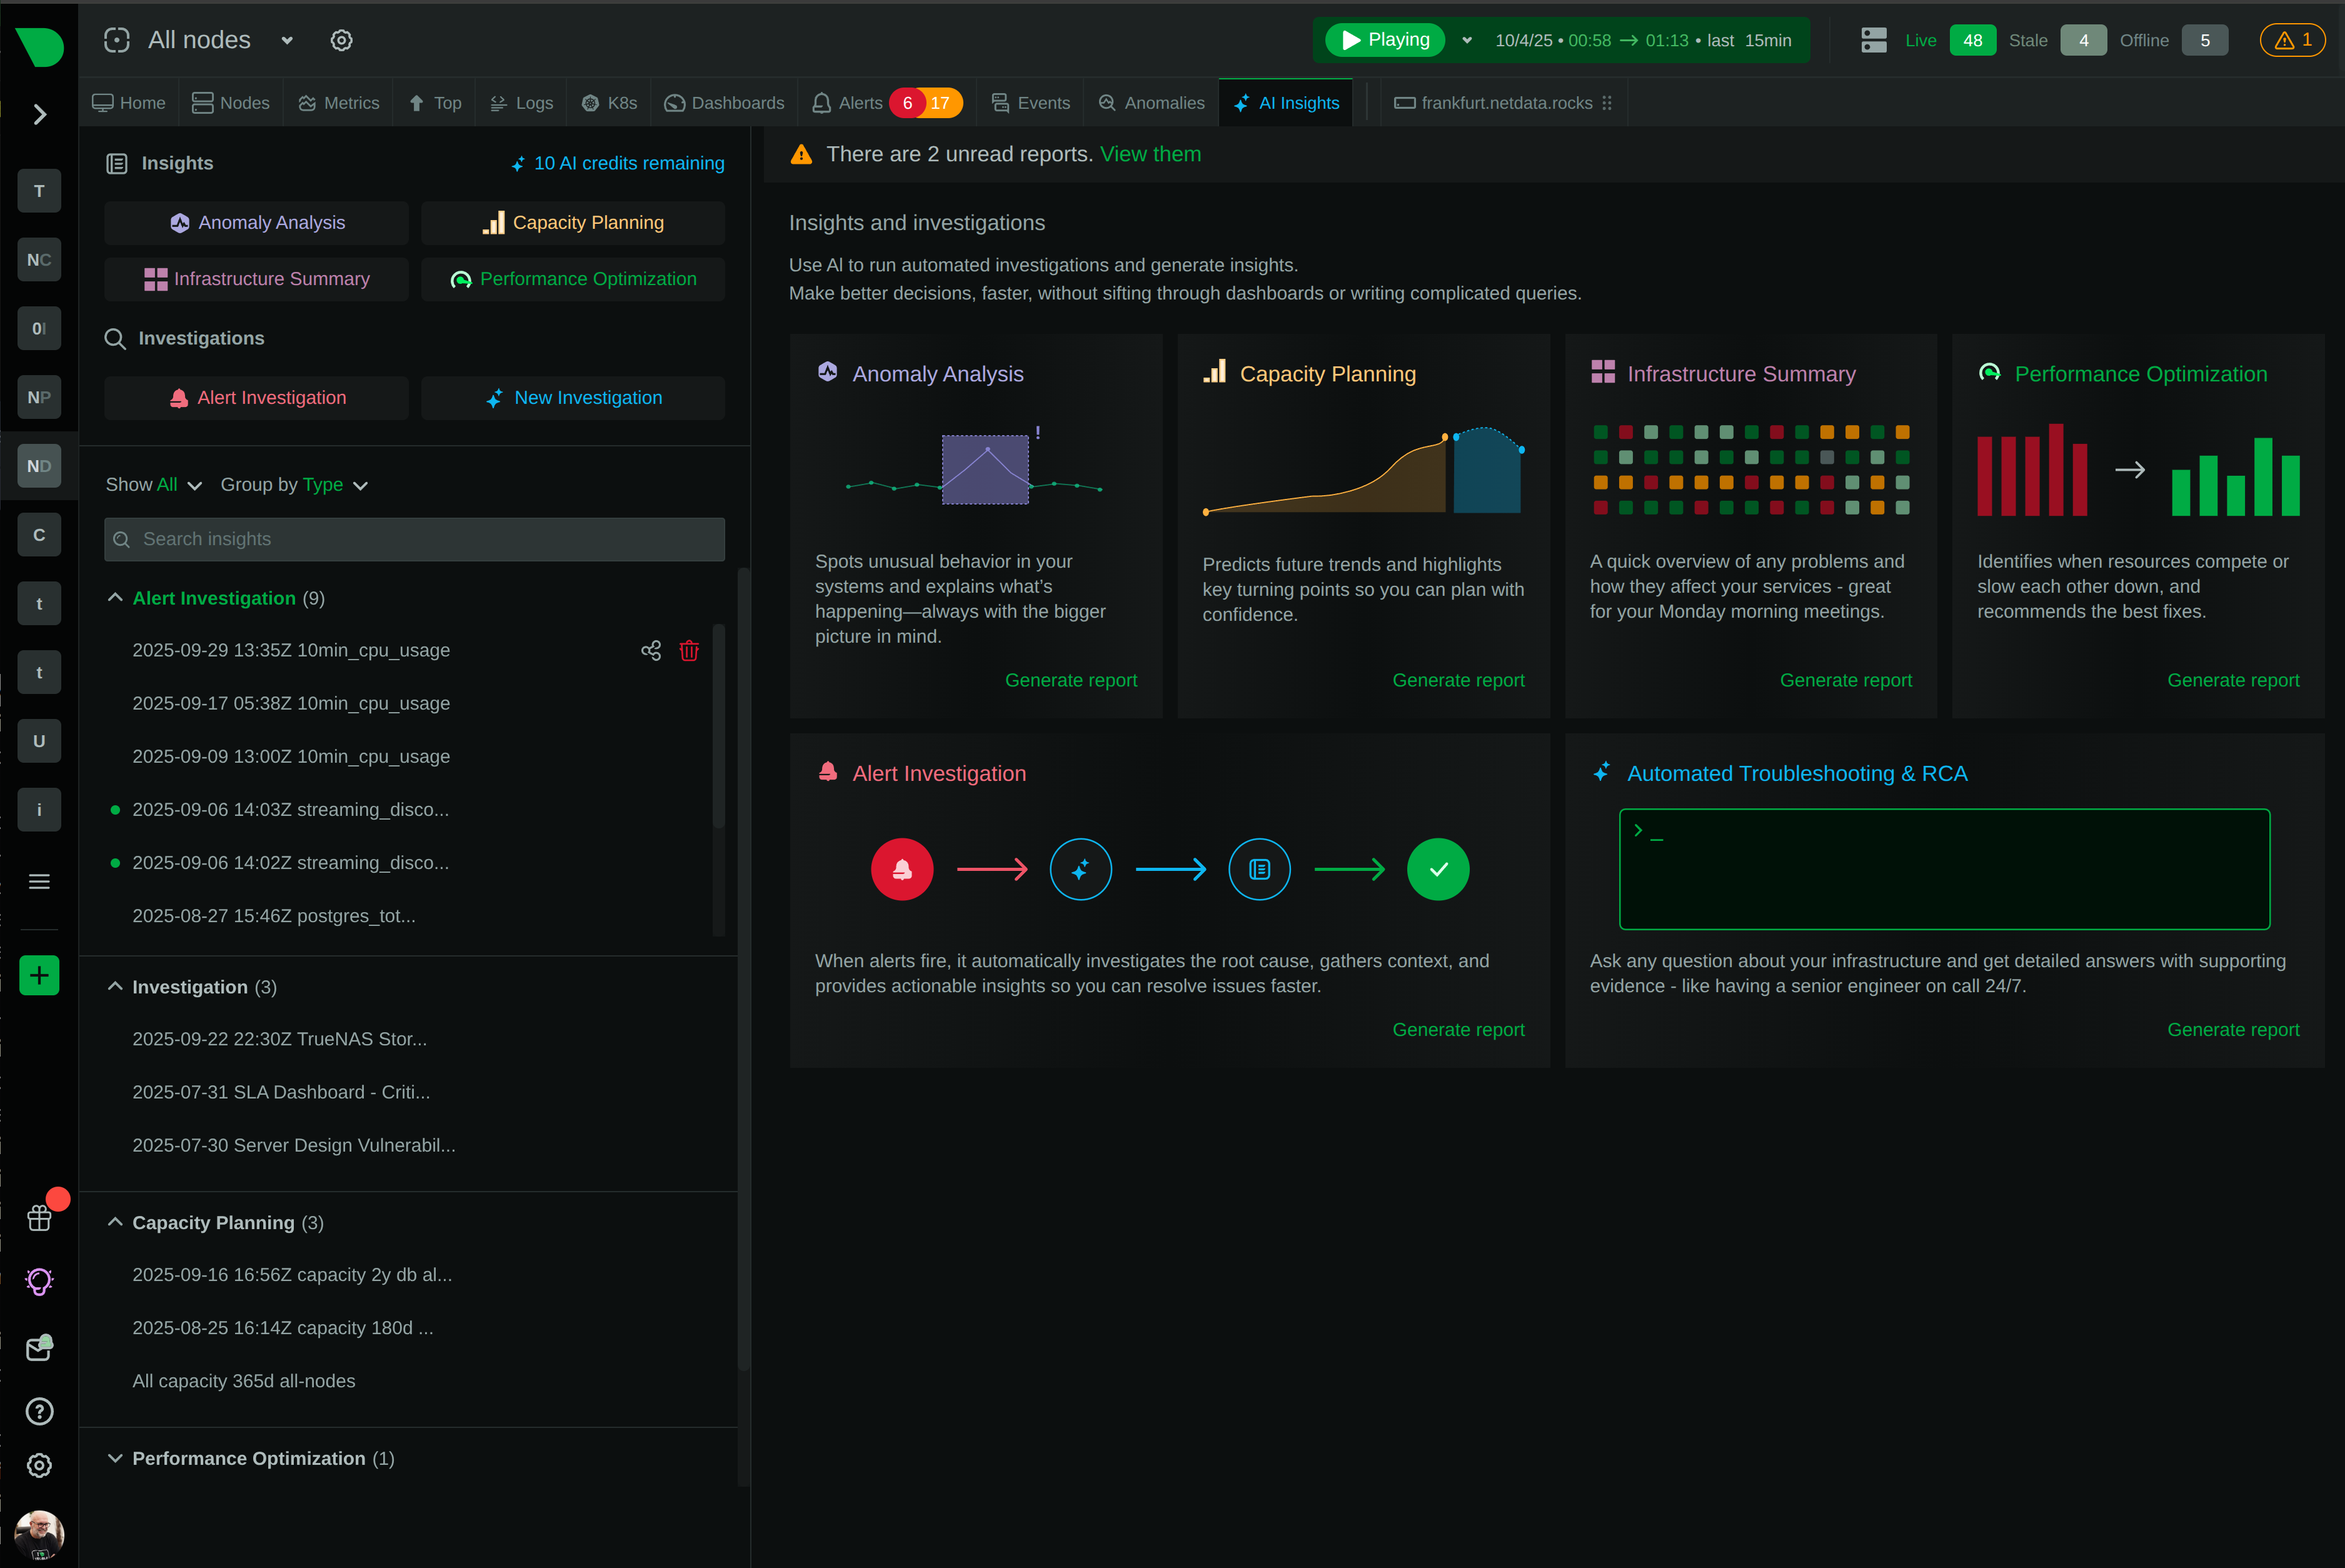
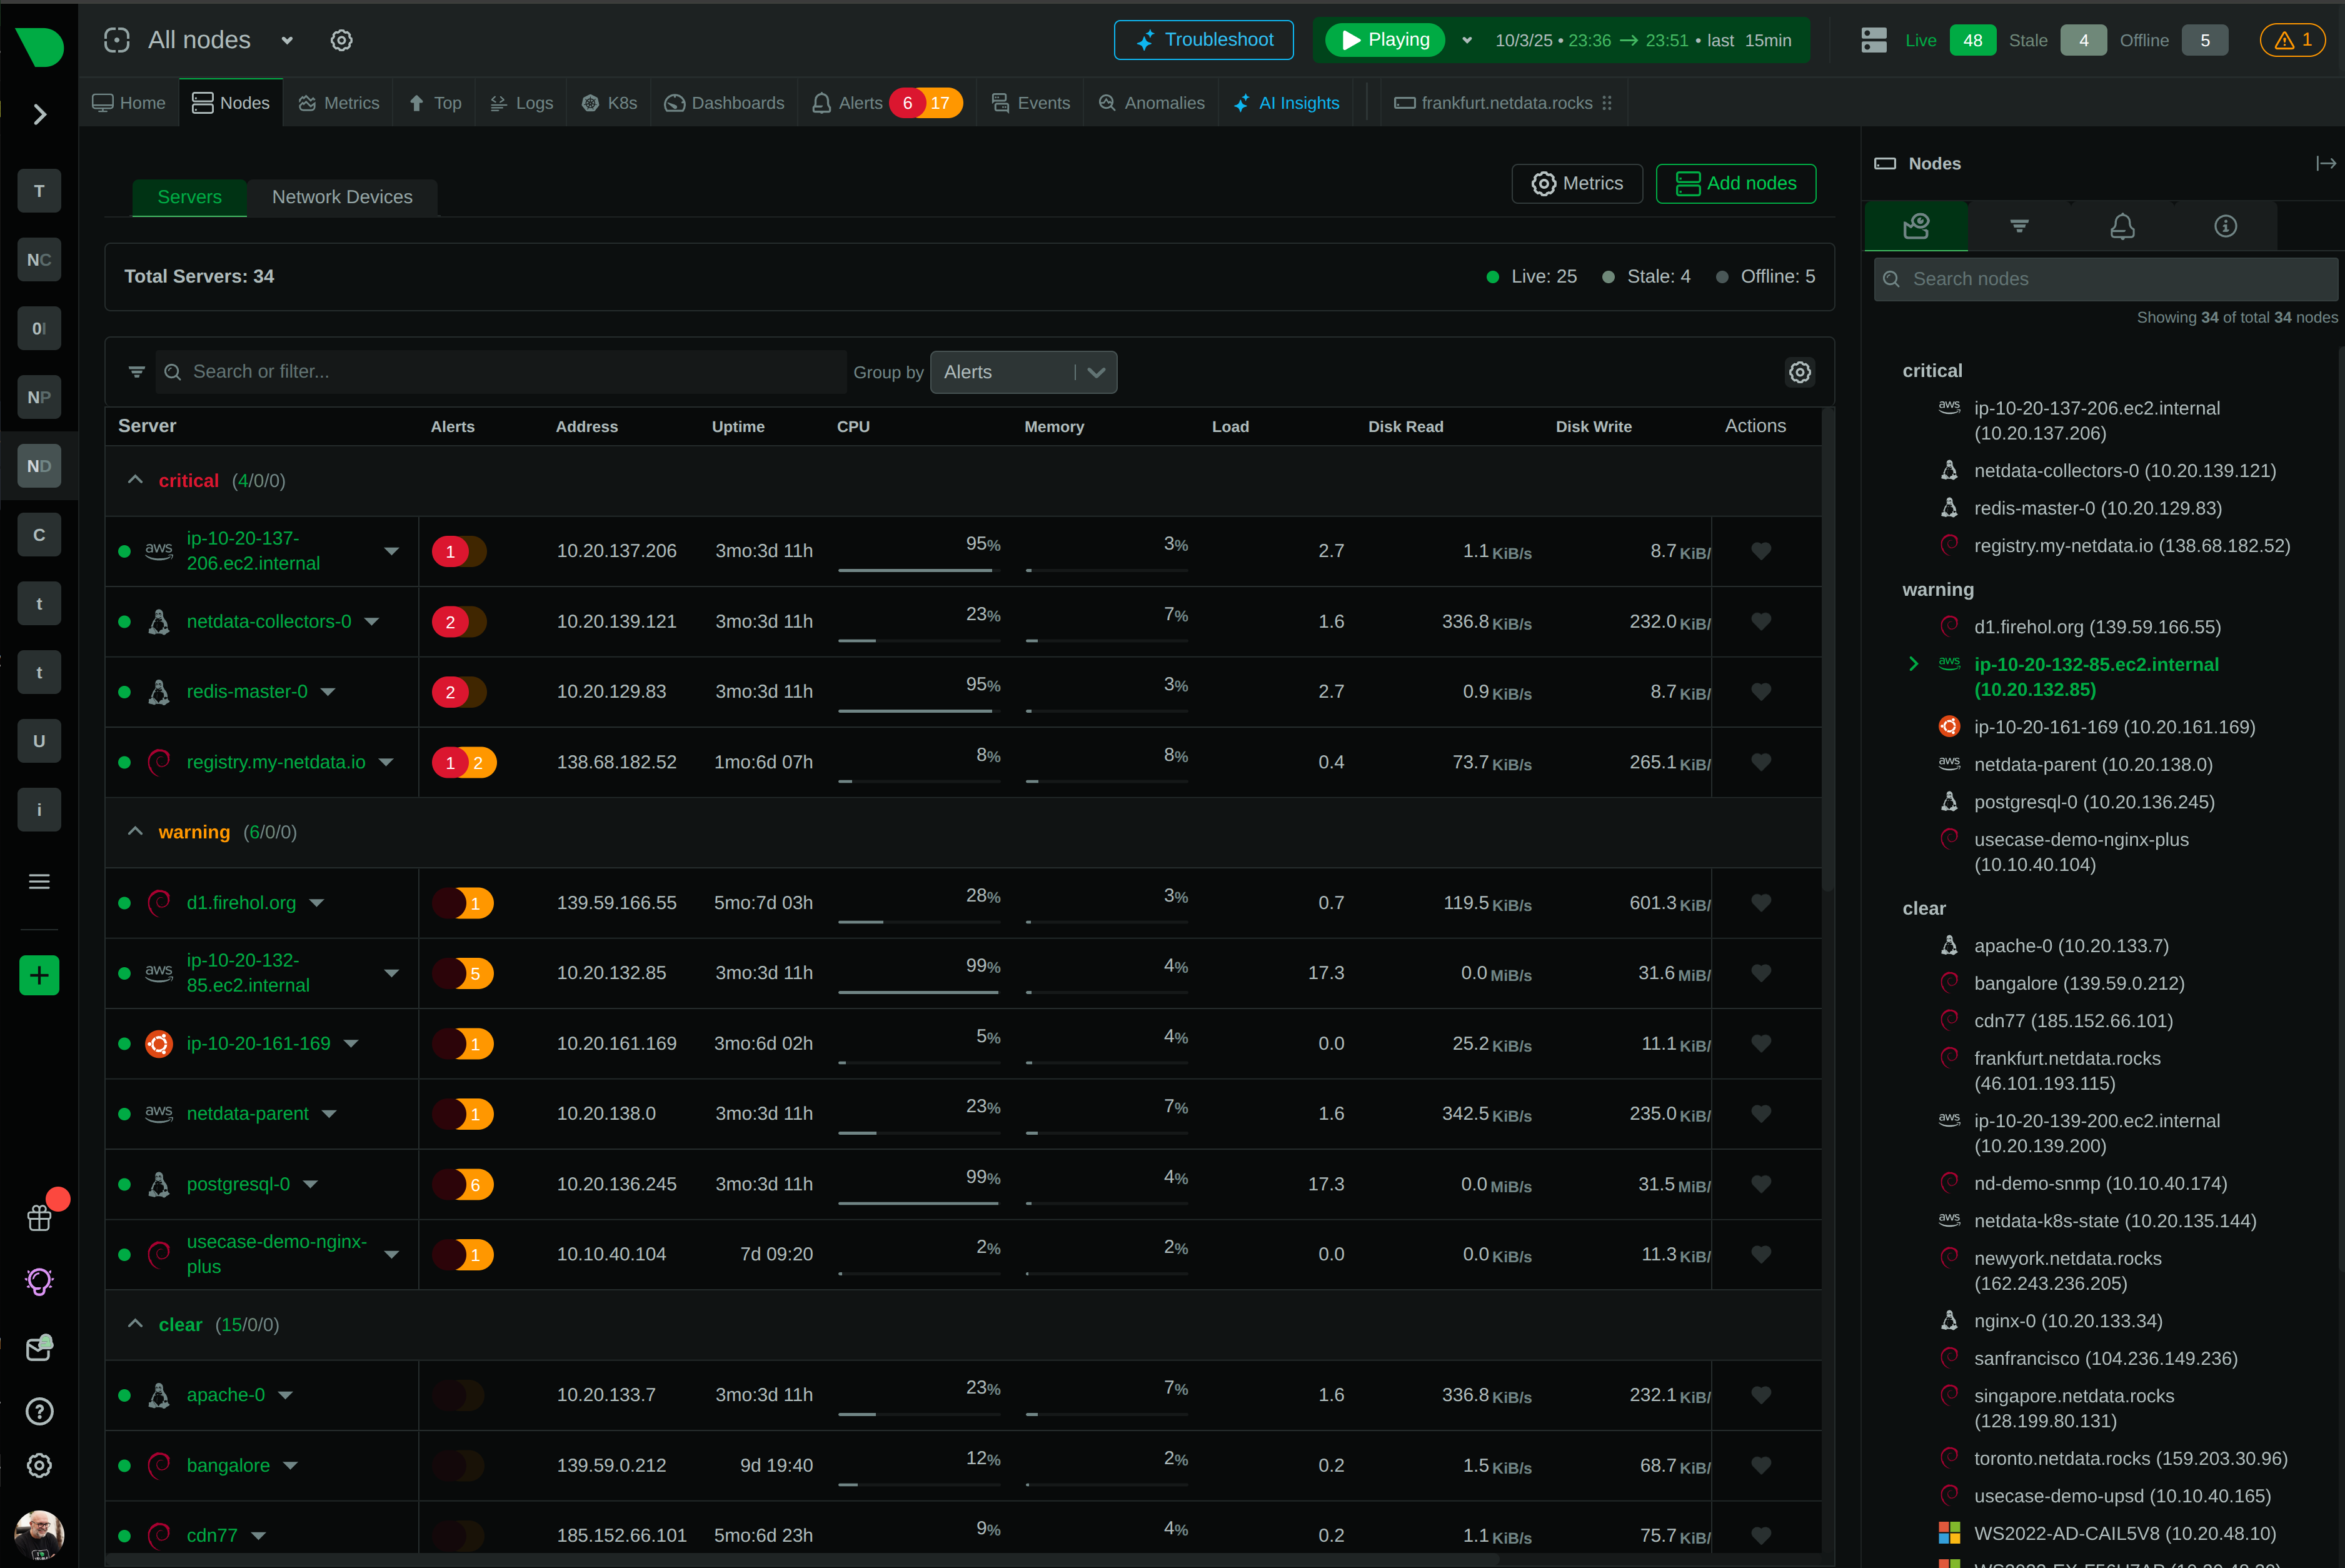
See What SCOM Misses - Per-Second Visibility Without the Complexity

SCOM users face a critical choice: continue managing complex, minute-level monitoring that misses 90% of transient issues, or embrace modern observability that delivers per-second insights, zero-configuration deployment, and 90% lower costs. Netdata transforms infrastructure monitoring from a specialized skill into an automated capability - enabling lean teams to manage thousands of nodes with the same ease SCOM requires for hundreds.

Background Hero

Why Operations Teams Choose Netdata Over SCOM

Six fundamental advantages that transform infrastructure monitoring

True Real-Time Monitoring

Per-second data collection with 1-second visualization latency vs SCOM’s minute-level polling. Catch transient issues, microbursts, and security threats that SCOM’s 30-60 second intervals completely miss.

60-Second Deployment

From installation to production dashboards in 60 seconds vs SCOM’s weeks-to-months setup. Zero configuration, automatic discovery, instant value - no SCOM experts, XML authoring, or extensive training required.

AI-Powered Intelligence

18 ML models per metric train automatically at the edge, achieving 99% false positive reduction in anomaly detection. Anomaly Advisor surfaces root cause in top 30-50 results vs SCOM’s manual investigation.

90% Lower Total Cost

Transparent predictable per-node pricing vs SCOM’s complex core-based licensing plus CMLs, support contracts, SQL Server, and dedicated administrators. Costs scale linearly with infrastructure.

Universal Platform Support

Native Linux, Windows, FreeBSD, macOS with 800+ integrations vs SCOM’s Windows-centric design. Full Kubernetes, multi-cloud (AWS/Azure/GCP), and container support where SCOM struggles.

Linear Scalability

Unlimited nodes with distributed edge architecture vs SCOM’s 15,000 agent hard limit. No central bottlenecks, no SQL Server single point of failure, constant performance from 10 to 100,000 nodes.

Trusted by DevOps teams worldwide

Platform Comparison

Netdata vs SCOM: Architectural Differences

SCOM’s centralized, Windows-centric architecture creates complexity, performance bottlenecks, and scalability limits. Netdata’s distributed edge design delivers real-time intelligence, universal platform support, and linear scaling - fundamentally reimagining infrastructure monitoring for modern operations teams.

Capability

Netdata

SCOM

Data Granularity

✅ Per-Second
1-second collection, 1-second visualization latency

⚠️ Minute-Level
30-60 second polling, misses transient issues

Time to Production

✅ 60 Seconds
One-line install to automatic dashboards

❌ Weeks to Months
Complex setup, extensive configuration required

Configuration Required

✅ Zero-Config
Automatic discovery, algorithmic dashboards

❌ Extensive
XML authoring, manual MP configuration

Architecture

✅ Distributed Edge
Intelligence at source, no bottlenecks

⚠️ Centralized
SQL Server single point of failure

Scalability Limit

✅ Unlimited
100,000+ nodes proven, linear scaling

❌ 15,000 Maximum
Hard limit per Management Group

Cross-Platform

✅ Universal
Native Linux, Windows, BSD, macOS

⚠️ Windows-Centric
Limited Linux/UNIX, poor cloud support

Cloud Monitoring

✅ Multi-Cloud Native
AWS, Azure, GCP, Kubernetes-native

❌ Azure-Only Focus
Weak AWS/GCP, no container orchestration

AI/ML Capabilities

✅ Native Edge ML
18 models/metric, 99% false positive reduction

⚠️ Requires Azure
Static thresholds, no native ML

Dashboard Creation

✅ Automatic
Algorithmic generation, point-and-click analysis

❌ Manual SSRS
Complex Report Builder, slow generation

Agent Resource Usage

✅ <5% CPU, 150-200MB RAM
Most energy-efficient (peer-reviewed)

⚠️ High Overhead
Frequent restarts, resource exhaustion

Pricing Model

✅ Predictable Per-Node
All-inclusive: metrics, logs, users, AI

❌ Complex Licensing
Core-based + CMLs + support + SQL + labor

Learning Curve

✅ Zero Training
Point-and-click, no query languages

❌ 1+ Years
SCOM expert required, MP authoring complex

Transform Your Operations with Modern Observability

Troubleshoot at the Speed of Thought

SCOM’s minute-level polling creates 20+ second console lag and misses 90% of transient issues. Netdata’s per-second monitoring with 1-second visualization latency reveals microbursts, security threats, and cascading failures invisible to traditional monitoring. Engineers see immediate impact of changes - iterative troubleshooting becomes 10-30× faster.

80% Faster MTTR

See Real-Time Monitoring

Troubleshoot at the Speed of Thought

Deploy in Minutes, Not Months

SCOM requires weeks of setup - Windows Server, SQL Server, management packs, gateway servers, reporting configuration, alert tuning. Netdata installs with one command, auto-discovers 800+ integrations, generates algorithmic dashboards instantly, and trains ML models automatically. Zero configuration files, zero query languages, zero specialized skills - production-ready in 60 seconds.

100× Faster Deployment

Try Zero-Config Monitoring

Deploy in Minutes, Not Months

Empower Every Team Member

SCOM demands specialized expertise - XML authoring, PowerShell scripting, management pack tuning, SSRS report building. Junior engineers avoid the console; only SCOM experts troubleshoot effectively. Netdata’s point-and-click NIDL framework, algorithmic dashboards, and AI-powered insights democratize observability. Every team member - junior to senior - operates at expert level from day one.

Zero Training Required

Explore AI Co-Engineer

Empower Every Team Member

Scale Without Limits or Complexity

SCOM hits hard limits at 15,000 agents per Management Group, with database bottlenecks degrading performance beyond 5,000 nodes. Complex federation required for larger deployments. Netdata’s distributed edge architecture scales linearly to 100,000+ nodes - each Agent operates independently, Parents aggregate without bottlenecks, query performance remains constant. No architectural rewrites as infrastructure grows.

Unlimited Scalability

Learn About Edge Architecture

Scale Without Limits or Complexity

Feature Comparison

Monitoring Features Side by Side

SCOM provides deep Windows ecosystem integration but struggles with modern infrastructure - Linux, containers, Kubernetes, multi-cloud. Netdata delivers universal platform support with comprehensive coverage across all environments, from legacy Windows to cloud-native workloads.

Feature

Netdata

SCOM

Operating System Monitoring

✅ Universal
Linux, Windows, FreeBSD, macOS - native support

⚠️ Windows-Centric
Limited Linux/UNIX, frequent agent issues

Container Monitoring

✅ Native Support
Docker, containerd, Podman, LXC - auto-discovery

❌ Limited
Requires specialized MPs, poor coverage

Kubernetes Monitoring

✅ Kubernetes-Native
Helm chart, pod lifecycle, service mesh

❌ Not Supported
No native orchestration monitoring

Cloud Platform Support

✅ Multi-Cloud
AWS, Azure, GCP - native integrations

⚠️ Azure-Only
Weak AWS/GCP, SCOM MI deprecated

Database Monitoring

✅ Universal
PostgreSQL, MySQL, MSSQL, MongoDB, Redis

✅ Advanced
Strong SQL Server, requires MPs for others

Application Monitoring

✅ 800+ Integrations
Web servers, message brokers, caches - auto-discovered

⚠️ MP-Dependent
200+ MPs, complex management

Network Device Monitoring

✅ SNMP v1/v2c/v3
Routers, switches, firewalls - auto-discovery

✅ SNMP Support
Polling only, no v3 traps

Hardware Monitoring

✅ Comprehensive
IPMI, GPUs, sensors, EDAC ECC, RAPL

⚠️ Limited
Basic hardware, requires vendor MPs

Synthetic Monitoring

✅ Built-In
HTTP, TCP, DNS, ping - no configuration

⚠️ Basic
URL monitoring, limited protocols

Custom Metrics

✅ Multiple Methods
StatsD, OpenMetrics, OTel, REST APIs

⚠️ Complex
Requires custom MP authoring

Process Monitoring

✅ Real-Time
Per-second process metrics, cgroup tracking

✅ Advanced
Windows process monitoring strong

Log Management

✅ Zero Pipeline
Direct systemd-journal, Windows Event Logs

⚠️ Limited
Basic event log collection, no analysis

View All Integrations

Netdata's Unique Advantages

See Every Second That Matters

SCOM's minute-level polling creates blind spots where most operational issues hide. Netdata's per-second monitoring with 1-second visualization latency reveals microbursts, security threats, and cascading failures - enabling 80% faster MTTR through immediate visibility.

60× more granular than SCOM

Learn About Real-Time Monitoring
Real-Time Dashboard

Use Case Comparison

Netdata vs SCOM Use Cases

SCOM excels at traditional Windows datacenter monitoring but struggles with modern infrastructure patterns. Netdata delivers comprehensive observability across legacy and modern workloads - from Windows servers to Kubernetes clusters, on-premises to multi-cloud.

Use Case

Netdata

SCOM

Real-Time Infrastructure Monitoring

✅ Ideal
Per-second visibility, instant troubleshooting

⚠️ Limited
Minute-level polling, delayed insights

Live Troubleshooting

✅ Console Replacement
Browser-based debugging, no SSH required

❌ Not Supported
Requires SSH/RDP for live diagnostics

Capacity Planning

✅ Advanced
AI-powered forecasting, trend analysis

✅ Advanced
Data warehouse historical analysis

Windows Datacenter Monitoring

✅ Comprehensive
System-level monitoring, good coverage

✅ Advanced
Deep Exchange, SharePoint, AD integration

Linux/UNIX Monitoring

✅ Ideal
Born on Linux, comprehensive support

⚠️ Limited
Bolted-on support, frequent issues

Container & Kubernetes

✅ Ideal
Helm chart, pod lifecycle, service mesh

❌ Not Supported
No native container orchestration

Multi-Cloud Monitoring

✅ Ideal
AWS, Azure, GCP - unified visibility

⚠️ Azure-Focused
Weak AWS/GCP, SCOM MI deprecated

Hybrid Infrastructure

✅ Ideal
On-prem + cloud unified, single pane

⚠️ Challenging
On-prem focus, cloud gaps

Application Performance

✅ Advanced
Per-second process metrics, syscall monitoring

⚠️ Limited APM
700 agents max, 400 apps max

Security Monitoring

✅ Advanced
Per-second visibility, anomaly detection

⚠️ Basic
Event log collection, delayed analysis

Edge & IoT Monitoring

✅ Ideal
<100MB RAM on 32-bit systems

❌ Not Suitable
High resource requirements

Distributed Tracing

⚠️ Coming Q2 2026
OpenTelemetry traces planned

⚠️ Limited
Basic APM, no full tracing

Frequently Asked Questions