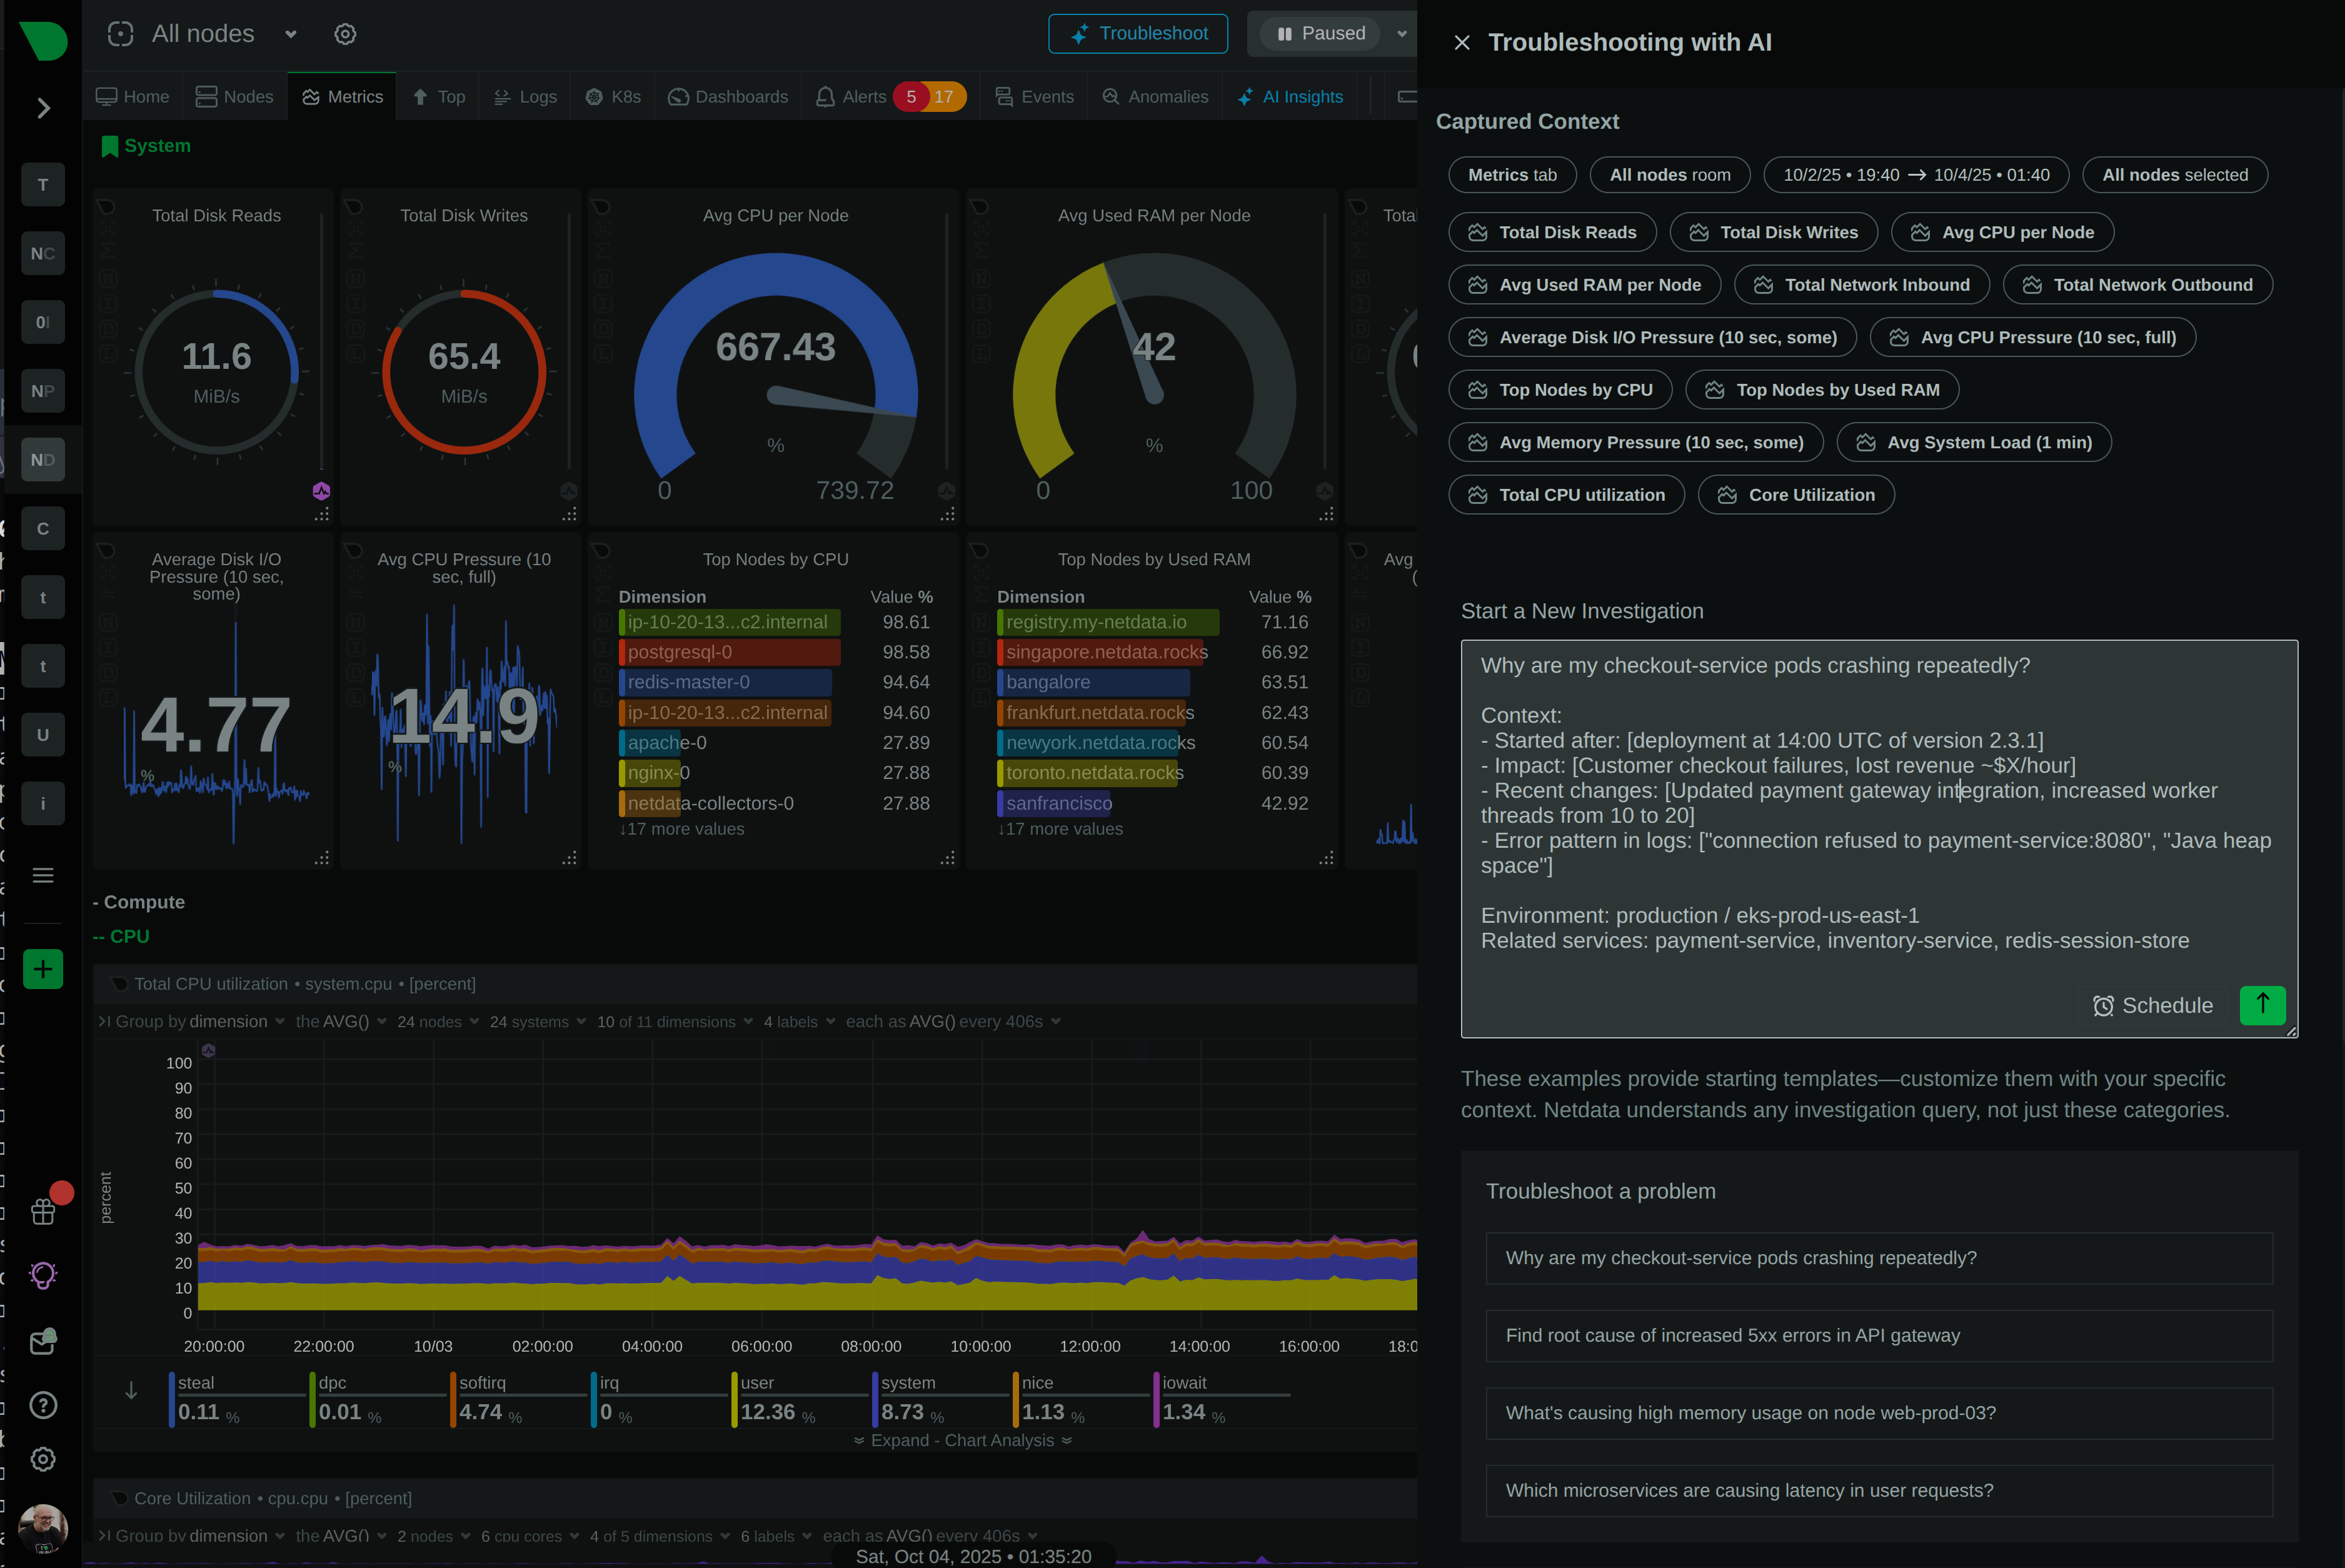
Choosing the right monitoring tool is critical for maintaining the health and performance of your infrastructure. For years, Nagios has been a staple in IT operations, known for its foundational state-checking capabilities. However, as systems become more complex, dynamic, and distributed, a new generation of tools has emerged. Netdata offers a modern, real-time approach to observability designed for today’s fast-paced environments.
This guide provides a direct comparison between Nagios and Netdata. We will look at their core philosophies, key features, and how they handle the demands of modern infrastructure monitoring. By the end, you’ll have a clear understanding of which solution is the better fit for your team’s needs.
Quick Comparison
Feature | Nagios | Netdata |
---|---|---|
Real-Time, Per-Second Metrics | ❌ | ✅ |
Automatic Service Discovery | ❌ | ✅ |
Zero-Configuration Setup | ❌ | ✅ |
Built-in Interactive Dashboards | ❌ | ✅ |
AI-Powered Anomaly Detection | ❌ | ✅ |
Designed for Dynamic Environments | ❌ | ✅ |
Low-Overhead Agent | ⚠️ | ✅ |
Free Open-Source Version | ✅ | ✅ |
What Is Netdata?
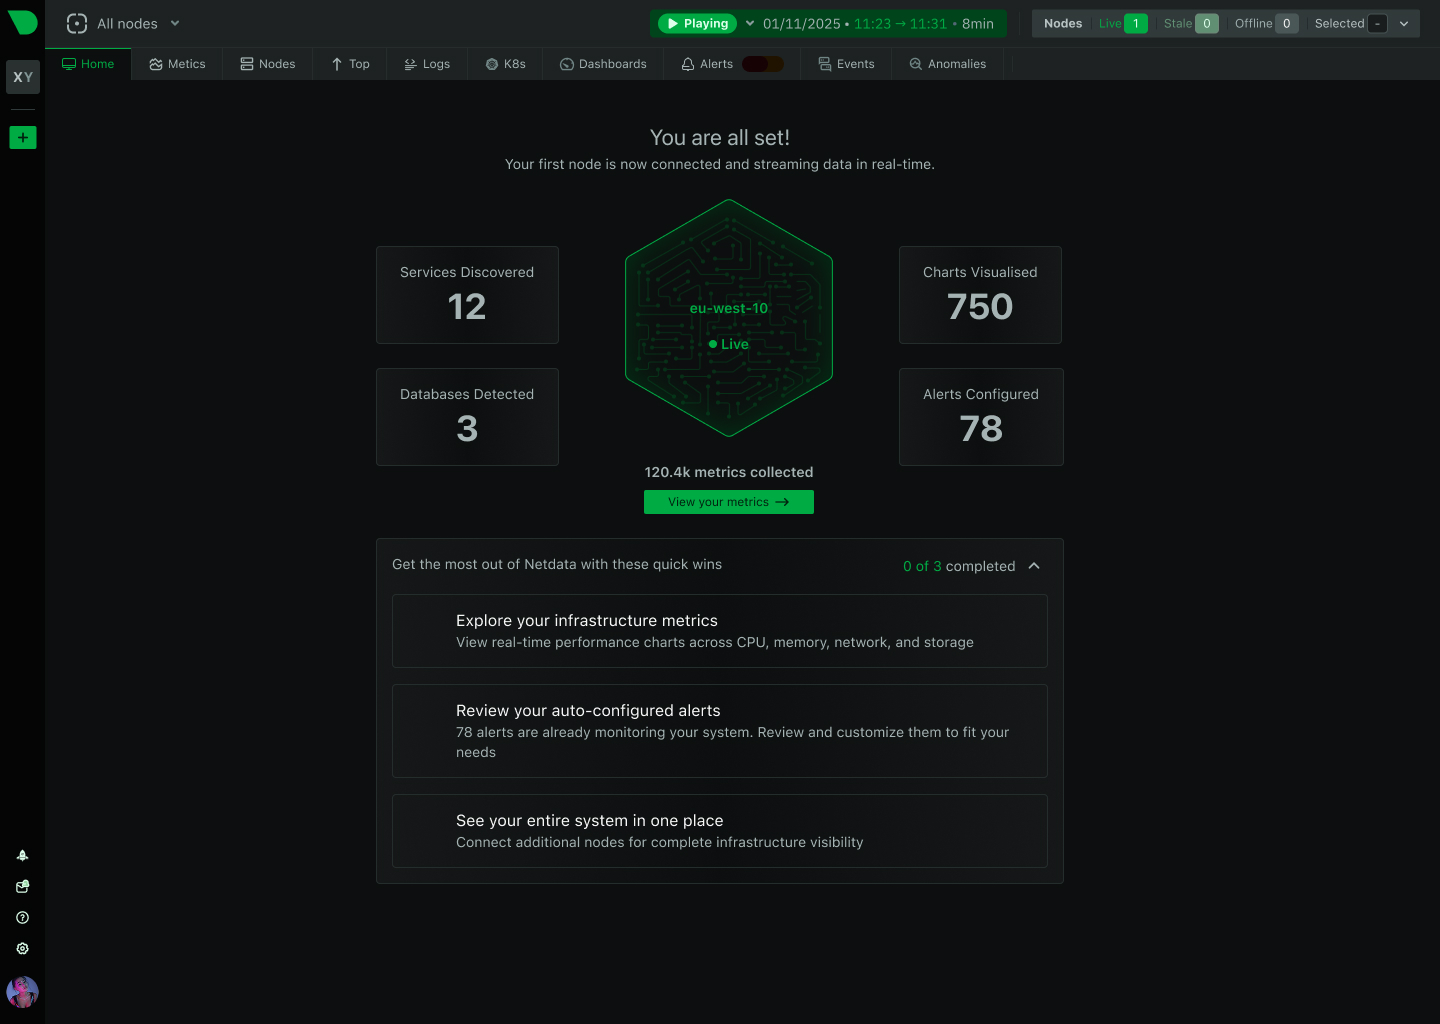
Netdata is an enterprise-grade, real-time observability platform built for troubleshooting modern, complex infrastructures. It provides unparalleled, per-second insights into your systems, containers, and applications with zero configuration. From the moment you install the Netdata Agent, it auto-discovers thousands of metrics and presents them in rich, interactive dashboards.
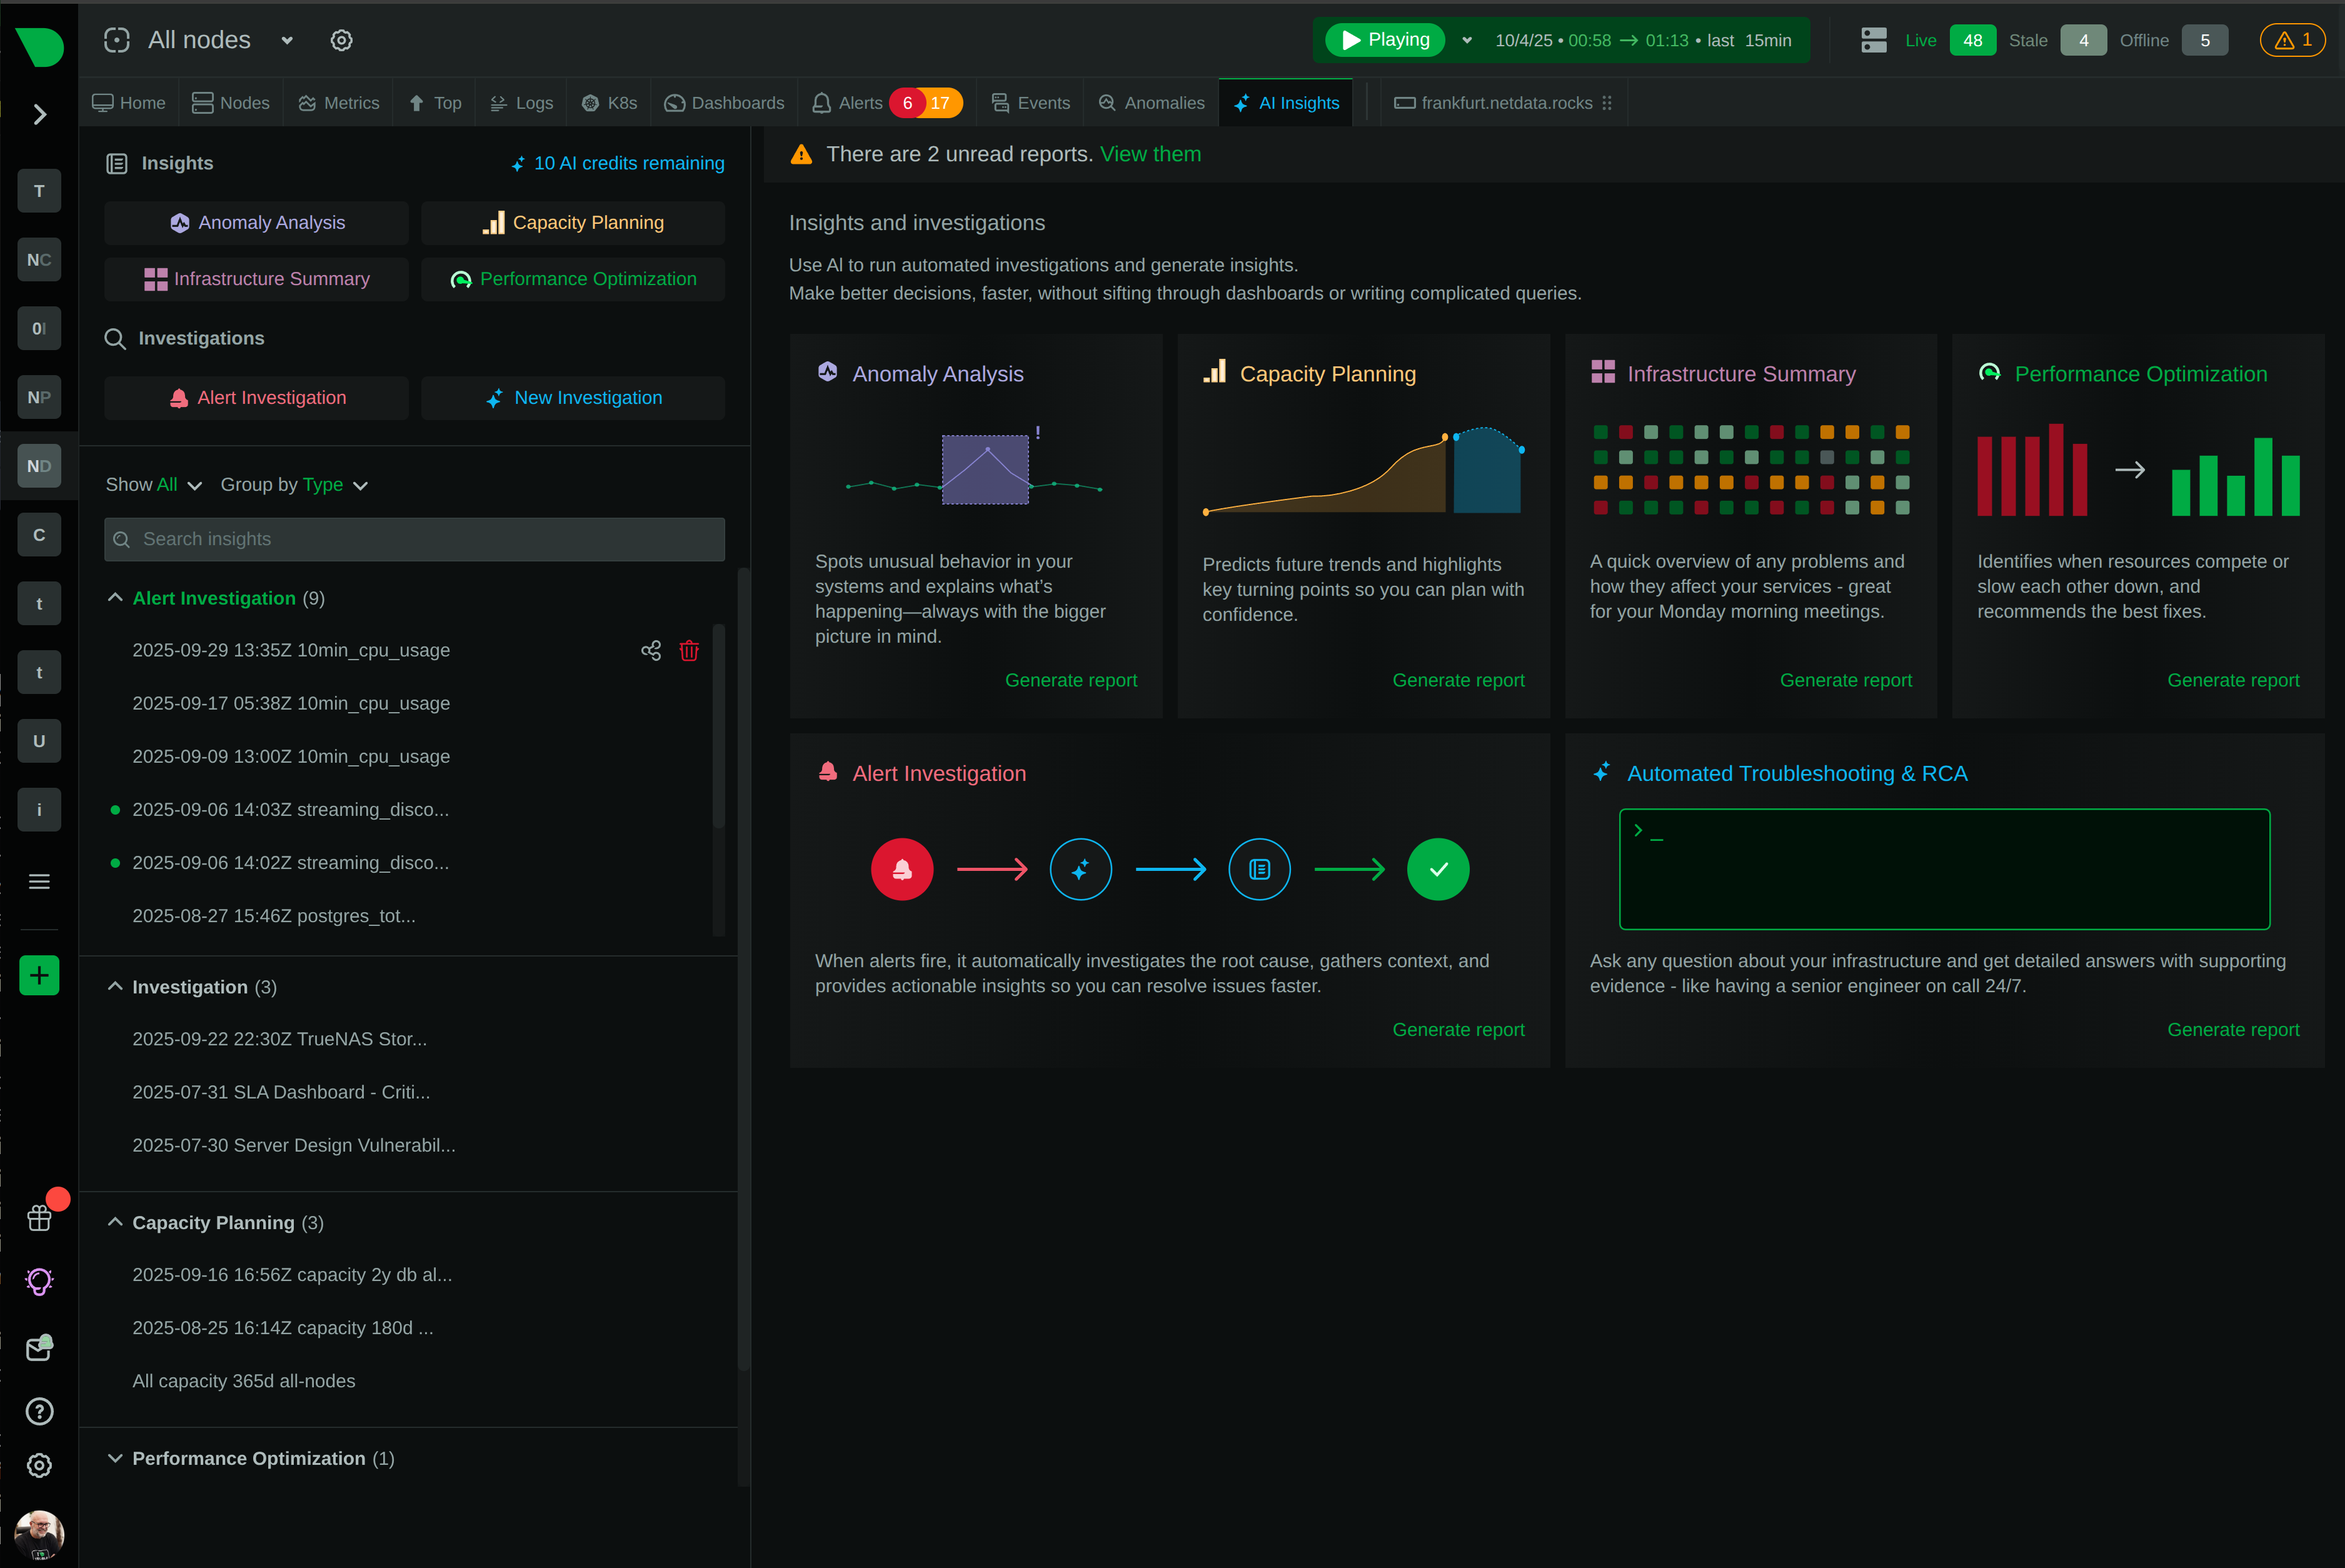
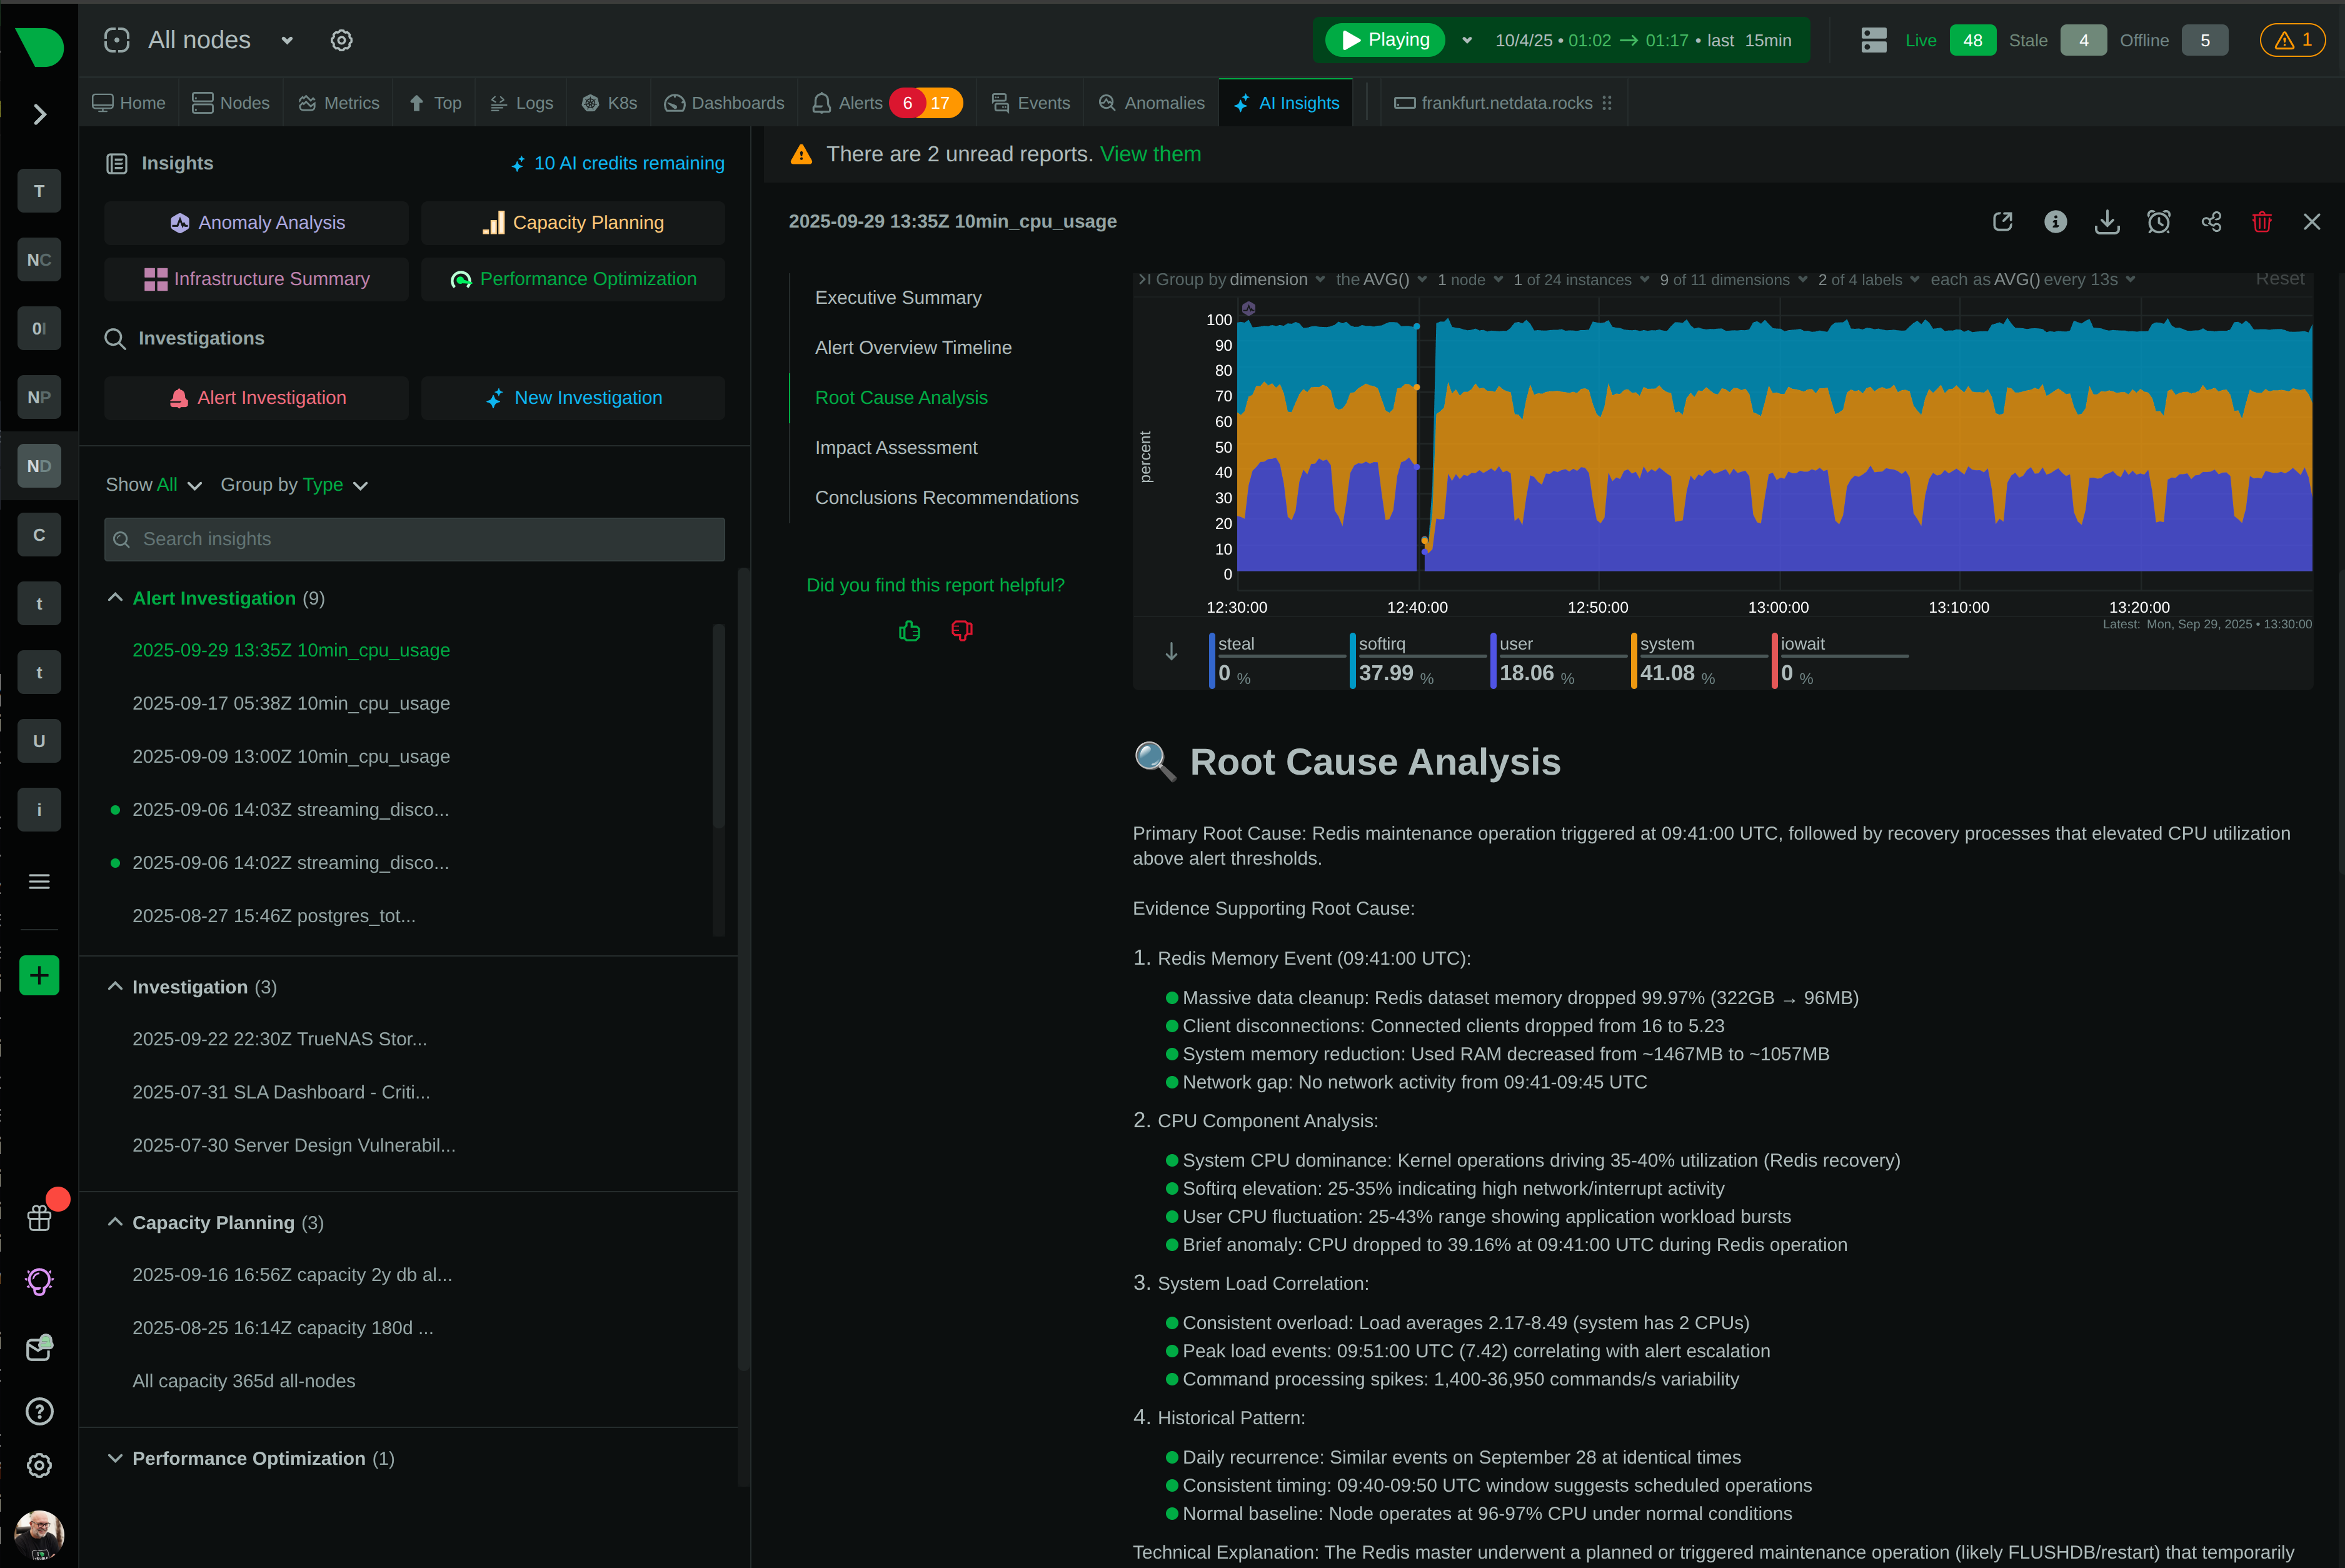
Designed for DevOps engineers, SREs, and developers, Netdata simplifies the process of monitoring. It uses on-device machine learning to detect anomalies in real-time and offers Agentic AI to automate investigation and root cause analysis. This shifts teams from a reactive “firefighting” mode to a proactive, data-driven engineering culture. Netdata is built to be incredibly efficient, ensuring that monitoring itself never becomes a performance bottleneck.
What Is Nagios?
Nagios is one of the pioneering open-source tools for IT infrastructure monitoring. First released in 1999, its core strength lies in state-based monitoring. Nagios checks the status of hosts and services (e.g., HTTP, SSH, disk space) at regular intervals and reports their state as OK, WARNING, CRITICAL, or UNKNOWN.
Its primary function is to alert system administrators when a predefined threshold is breached or a service goes down. Nagios is highly extensible through a vast ecosystem of plugins, allowing it to monitor almost any device or application. It consists of the open-source Nagios Core and a commercial version, Nagios XI, which adds features like dashboards, reporting, and configuration wizards. Nagios is typically favored by IT operations teams managing more traditional, static infrastructure.
Key Differences Between Netdata & Nagios
While both tools monitor infrastructure, their approaches, capabilities, and philosophies are fundamentally different. Nagios was built for an era of stable servers, while Netdata is designed for the dynamic, ephemeral nature of the cloud-native world.
Features & Functionality
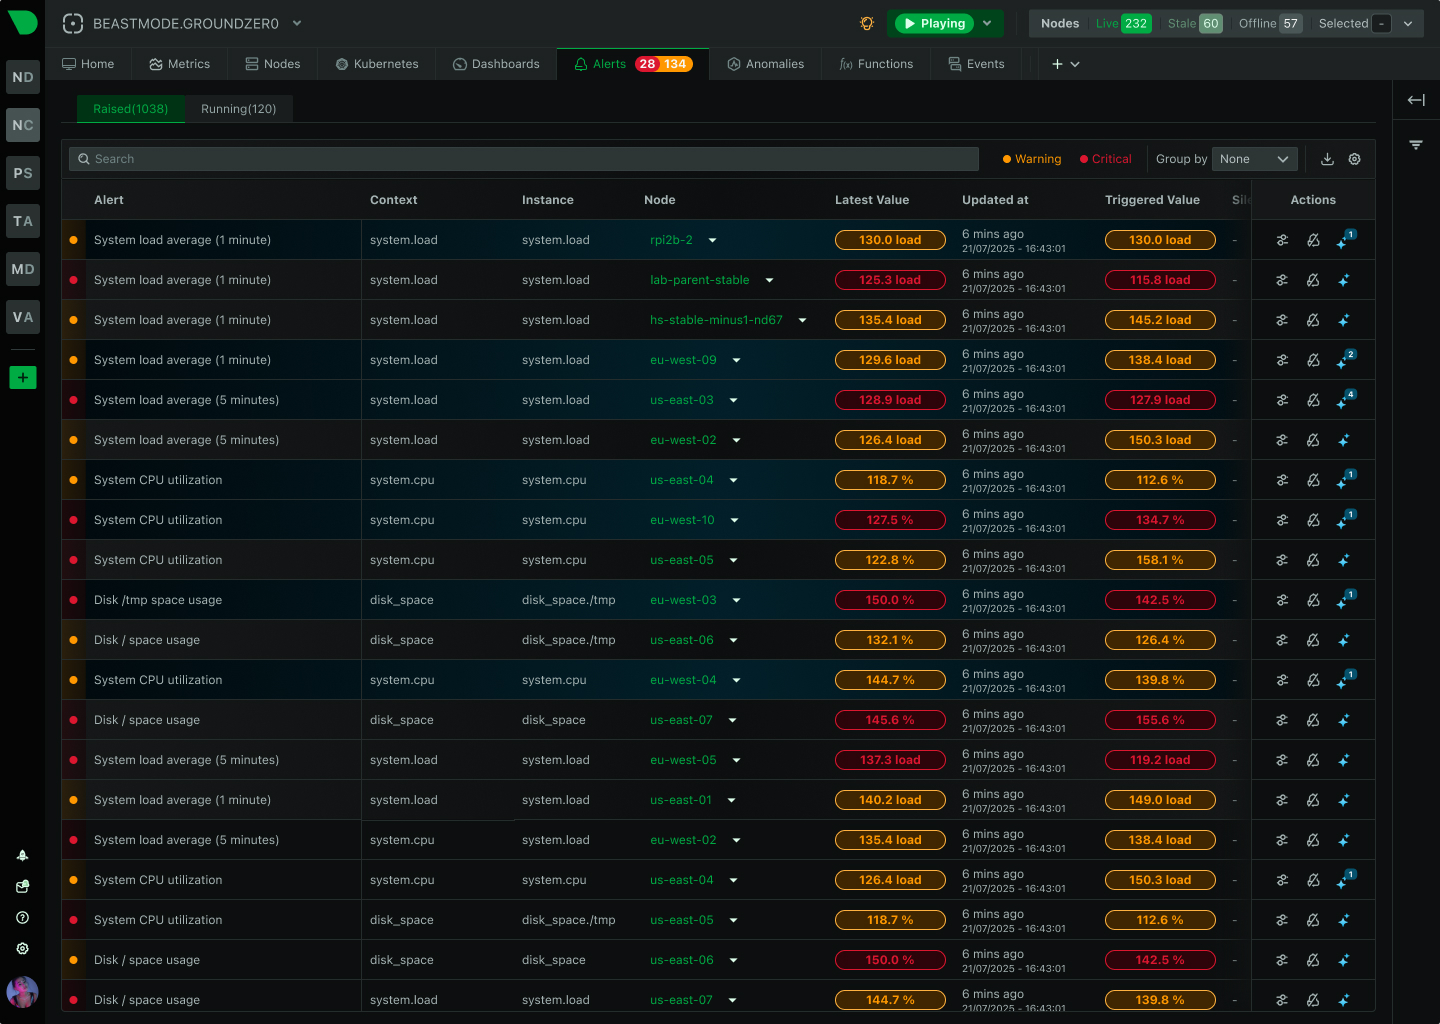
The most significant difference lies in granularity and automation. Nagios operates on a polling model, typically checking services every few minutes. It tells you if a service is down. Netdata collects metrics every single second, allowing you to see why a service is slow or failing.
- Autodiscovery: With Netdata, you install the agent and it automatically discovers all running services, applications, and system metrics. There are no configuration files to edit. Nagios requires you to manually define every host, service, and check command in text-based configuration files. As your infrastructure grows or changes, this manual configuration becomes a significant operational burden.
- Visualization: Netdata provides hundreds of pre-built, interactive charts out-of-the-box. You can zoom, pan, and filter data in real-time without writing a single query. Nagios Core offers a very basic web interface that primarily shows status lists. Achieving meaningful visualization with Nagios often requires integrating and configuring third-party tools like Grafana.
- AI and Machine Learning: Netdata has AI/ML capabilities built into its core. Every agent can run unsupervised machine learning models to detect anomalies on thousands of metrics simultaneously. Its Agentic AI helps you “talk” to your infrastructure to accelerate troubleshooting. Nagios has no native AI or ML features; it is a purely threshold-based system.
Ease of Use & Configuration
This is a critical point of comparison. Netdata is designed for simplicity and speed.
- Installation: You can install and get value from Netdata in minutes using a single command.
- Configuration: Nagios is notorious for its steep learning curve and complex configuration. A simple setup can involve editing multiple files to define hosts, services, commands, contacts, and time periods. For new engineers, this process can be daunting and error-prone. Maintaining these configurations in a dynamic environment with frequent deployments is a constant challenge.
For example, to monitor a web server’s CPU load in Nagios, you would need to:
- Ensure the NRPE agent is installed on the remote host.
- Define a
check_load
command in your commands configuration file. - Define the host in a host configuration file.
- Define a service that uses the
check_load
command and associates it with that host. - Reload the Nagios service to apply the changes.
With Netdata, you simply install the agent. The CPU metrics are automatically collected and displayed.
Architecture & Scalability
Netdata’s architecture is distributed by design. Data is collected, stored, and processed at the edge (on the node itself), which drastically reduces network traffic and eliminates central data bottlenecks. For centralized views, Netdata uses a highly efficient streaming protocol to send metrics to a parent Netdata instance. This model scales horizontally with ease.
Nagios uses a centralized polling architecture. A central Nagios server is responsible for scheduling and executing checks on all monitored hosts. This can become a bottleneck in large environments, leading to check latency and missed alerts. Scaling Nagios often requires complex setups with distributed pollers (e.g., using Nagios Fusion or other add-ons), adding another layer of configuration and management.
Why Engineers Choose Netdata Over Nagios
Teams choose Netdata as a Nagios alternative to escape the limitations of legacy monitoring and embrace a more agile, insightful approach.
-
Escape Configuration Hell: The primary pain point for Nagios users is the endless cycle of editing configuration files. Engineers spend hours defining checks instead of analyzing performance. Netdata’s zero-configuration model gives that time back, providing instant visibility across the entire stack.
-
Move from “What” to “Why”: A Nagios alert tells you “Host X is down.” Per-second metrics from Netdata let you see the CPU spike, memory leak, or disk I/O storm that occurred in the seconds leading up to the failure. This depth is essential for rapid root cause analysis in complex systems.
-
Monitor Modern Infrastructure: Nagios’s static, host-centric model struggles with containers, Kubernetes, and serverless functions that are created and destroyed in minutes. Netdata is built for this world. It automatically discovers new containers and services, collects their metrics, and stops monitoring them when they are gone, all without manual intervention.
-
Proactive Anomaly Detection: Instead of waiting for a critical threshold to be breached, Netdata’s ML can alert you to unusual behavior before it impacts users. This allows you to investigate potential issues proactively, reducing downtime and firefighting.
Nagios vs Netdata - Summary
Nagios remains a viable tool for small, static environments where simple up/down state checking is sufficient and where teams have the dedicated time and expertise to manage its manual configuration. It is a mature product with a large community.
Netdata is the superior choice for any team managing modern, dynamic infrastructure. If you value speed, automation, and deep, real-time insights, Netdata is the clear winner. It empowers engineers to troubleshoot complex problems quickly, reduces manual overhead, and provides the AI-driven observability needed to stay ahead of issues in cloud-native environments.
Try Netdata! The Best Nagios Alternative
Ready to move beyond basic state checks and endless configuration files? Experience the power of real-time, zero-configuration, AI-powered observability. Netdata gives you the insights you need to build more resilient and performant systems.
Netdata vs Nagios FAQs
Is it easy to migrate from Nagios to Netdata?
Yes. Migration is straightforward because you can run both systems in parallel. The process involves installing the lightweight Netdata Agent on your nodes. It will immediately auto-discover services and metrics, providing value without requiring you to turn off Nagios. You can gradually move your alerting and dashboarding to Netdata as you gain confidence.
Does Netdata integrate with my existing tech stack?
Absolutely. Netdata integrates with hundreds of technologies out-of-the-box and sends notifications to all popular collaboration and incident management tools, including Slack, PagerDuty, Discord, and Opsgenie. You can easily fit Netdata into your existing workflows.
Will I lose data when switching from Nagios to Netdata?
No. Since Netdata is a separate system, you won’t lose any historical data stored in your Nagios instance. By running both tools during the transition period, you ensure complete monitoring coverage and a safe migration path.
Does Netdata offer migration assistance or tools?
While there isn’t a single tool to convert Nagios configuration files, Netdata’s simplicity is the best migration aid. The automatic discovery of services and metrics eliminates the need to manually replicate your Nagios checks. The process is one of installation and discovery, not manual conversion. Our extensive documentation and community forums are also available to help.
Which tool is more scalable for growing businesses?
Netdata is fundamentally more scalable for growing and dynamic businesses. Its distributed architecture avoids the central bottlenecks that can plague Nagios setups. The efficient, low-overhead agent and native horizontal scaling capabilities are designed to handle thousands of nodes, containers, and metrics without compromising performance. Scaling Nagios typically requires more architectural planning, hardware, and manual configuration effort.