Netdata vs Prometheus: A Modern Take on Monitoring

A comprehensive look at architecture, features, and why teams are choosing a modern Prometheus alternative.

Netdata vs Prometheus: A Modern Take on Monitoring

Choosing the right monitoring tool is critical for maintaining reliable and performant systems. For years, Prometheus has been a go-to choice for many, known for its powerful data model and query language. However, as infrastructure becomes more complex and dynamic, teams are seeking solutions that offer faster insights with less manual effort.

This is where Netdata comes in. It represents a modern approach to observability, prioritizing real-time, high-granularity data, zero-configuration setup, and built-in AI capabilities. This guide provides a detailed comparison of Netdata and Prometheus to help you decide which tool is the right fit for your engineering team. We’ll examine the core differences in their philosophy, architecture, and day-to-day use.

Quick Comparison: Netdata vs. Prometheus

Feature Netdata Prometheus
Real-time Granularity ✅ Per-second ❌ 15s+ default
Setup & Configuration ✅ Zero-config, auto-discovery ❌ Manual configuration
Built-in Visualization ✅ Rich, interactive dashboards ❌ Basic UI, requires Grafana
AI/ML Capabilities ✅ Anomaly detection & Agentic AI ❌ Static, rule-based alerting
All-in-One Solution ✅ Yes ❌ Requires ecosystem components
Architecture ✅ Distributed, edge-native ❌ Centralized scrape model
Ease of Use ✅ High ❌ Moderate to High complexity

What is Netdata?

Netdata is an enterprise-grade observability platform designed for real-time infrastructure monitoring, troubleshooting, and automated analysis. It delivers per-second metrics and visualizations instantly, with no complex setup required. By deploying a single, lightweight agent, Netdata auto-discovers thousands of metrics from your systems, containers, and applications.

It’s designed for DevOps engineers, SREs, and IT professionals who need immediate, high-fidelity insights without the overhead of building and maintaining a complex monitoring stack. With unsupervised machine learning running at the edge and a powerful Agentic AI in the cloud, Netdata doesn’t just show you data; it helps you understand it, detecting anomalies and accelerating root cause analysis automatically.

Key Benefits of Netdata:

  • Instant Time-to-Value: Get comprehensive dashboards and per-second metrics just seconds after installation.
  • AI-Augmented Troubleshooting: Leverage ML at the edge for anomaly detection and Agentic AI to automatically investigate issues.
  • Extreme Granularity: Collect and visualize data every second, providing an unparalleled view into system behavior.
  • Simplified Stack: An all-in-one solution that includes data collection, storage, visualization, and alerting without needing third-party tools.
  • Low Overhead: The Netdata agent is highly efficient, minimizing CPU and memory usage on production systems.

What is Prometheus?

Prometheus is a powerful open-source monitoring and alerting toolkit originally built at SoundCloud and now a graduated project of the Cloud Native Computing Foundation (CNCF). It has become a standard for monitoring in the Kubernetes ecosystem.

Prometheus operates on a pull-based model, where a central server “scrapes” metrics from configured targets (endpoints) at regular intervals. It stores this data as time series and features a powerful query language, PromQL, for analyzing data and defining alert rules. Its architecture is modular, typically requiring separate components like Alertmanager for handling alerts and Grafana for advanced visualization.

Key Features of Prometheus:

  • Powerful Data Model: A multi-dimensional data model with time series identified by metric name and key/value pairs.
  • Flexible Query Language: PromQL allows for powerful slicing and dicing of collected data.
  • Service Discovery: Integrates well with platforms like Kubernetes for discovering scrape targets automatically.
  • Large Ecosystem: A vast number of “exporters” are available to provide metrics from third-party systems.

Key Differences Between Netdata and Prometheus

While both are monitoring tools, Netdata and Prometheus differ significantly in their architecture, philosophy, and user experience.

Architecture: Distributed Intelligence vs. Centralized Scraping

The most fundamental difference lies in their architecture. Prometheus uses a centralized, pull-based model. A Prometheus server periodically scrapes metrics from exporters running on your nodes. This means all raw data is pulled across the network and stored centrally.

Netdata employs a distributed, edge-native model. The Netdata Agent on each node is intelligent; it collects, stores, and processes metrics locally. It runs ML models for anomaly detection directly on the node. Only essential metadata and triggered alerts are sent to Netdata Cloud, drastically reducing network traffic and keeping your sensitive metric data within your perimeter by default. This design makes Netdata inherently more secure and efficient for large-scale or geographically dispersed deployments.

Time-to-Value: Zero-Config vs. Manual Setup

Getting started with Prometheus involves a multi-step configuration process:

  1. Install and run exporters on every system you want to monitor.
  2. Write and maintain a prometheus.yml configuration file, defining scrape targets.
  3. Set up service discovery for dynamic environments like Kubernetes.
  4. Configure and connect Alertmanager for notifications.
  5. Install, configure, and build dashboards in Grafana to visualize the data.

With Netdata, you run a single command to install the agent. That’s it. It automatically discovers all services, applications, and system resources on the node—from systemd services and applications to containers and virtual machines. Rich, interactive dashboards are instantly available, pre-configured with the most relevant metrics for each discovered component. This zero-configuration approach reduces setup time from hours or days to mere minutes.

Data Granularity & Real-Time Insights

Prometheus typically scrapes metrics every 15 or 30 seconds. While this can be adjusted, higher frequency increases the load on both the Prometheus server and the network. This latency means you’re always looking at the past, which can be a problem during a critical incident.

Netdata is built for real-time, per-second granularity. It collects and visualizes thousands of metrics every single second. This isn’t just a configuration option; it’s the default behavior. This high-fidelity view is like watching a live video of your system’s performance, allowing you to catch transient issues and understand system dynamics in a way that is impossible with lower-resolution data.

Alerting & Troubleshooting: AI-Powered vs. Rule-Based

Prometheus uses a powerful but manual alerting system. You write alert rules in PromQL, which are evaluated by the Prometheus server and fired to Alertmanager. This requires deep domain knowledge to create effective rules and can often lead to either alert fatigue or missed incidents.

Netdata transforms troubleshooting with AI and machine learning.

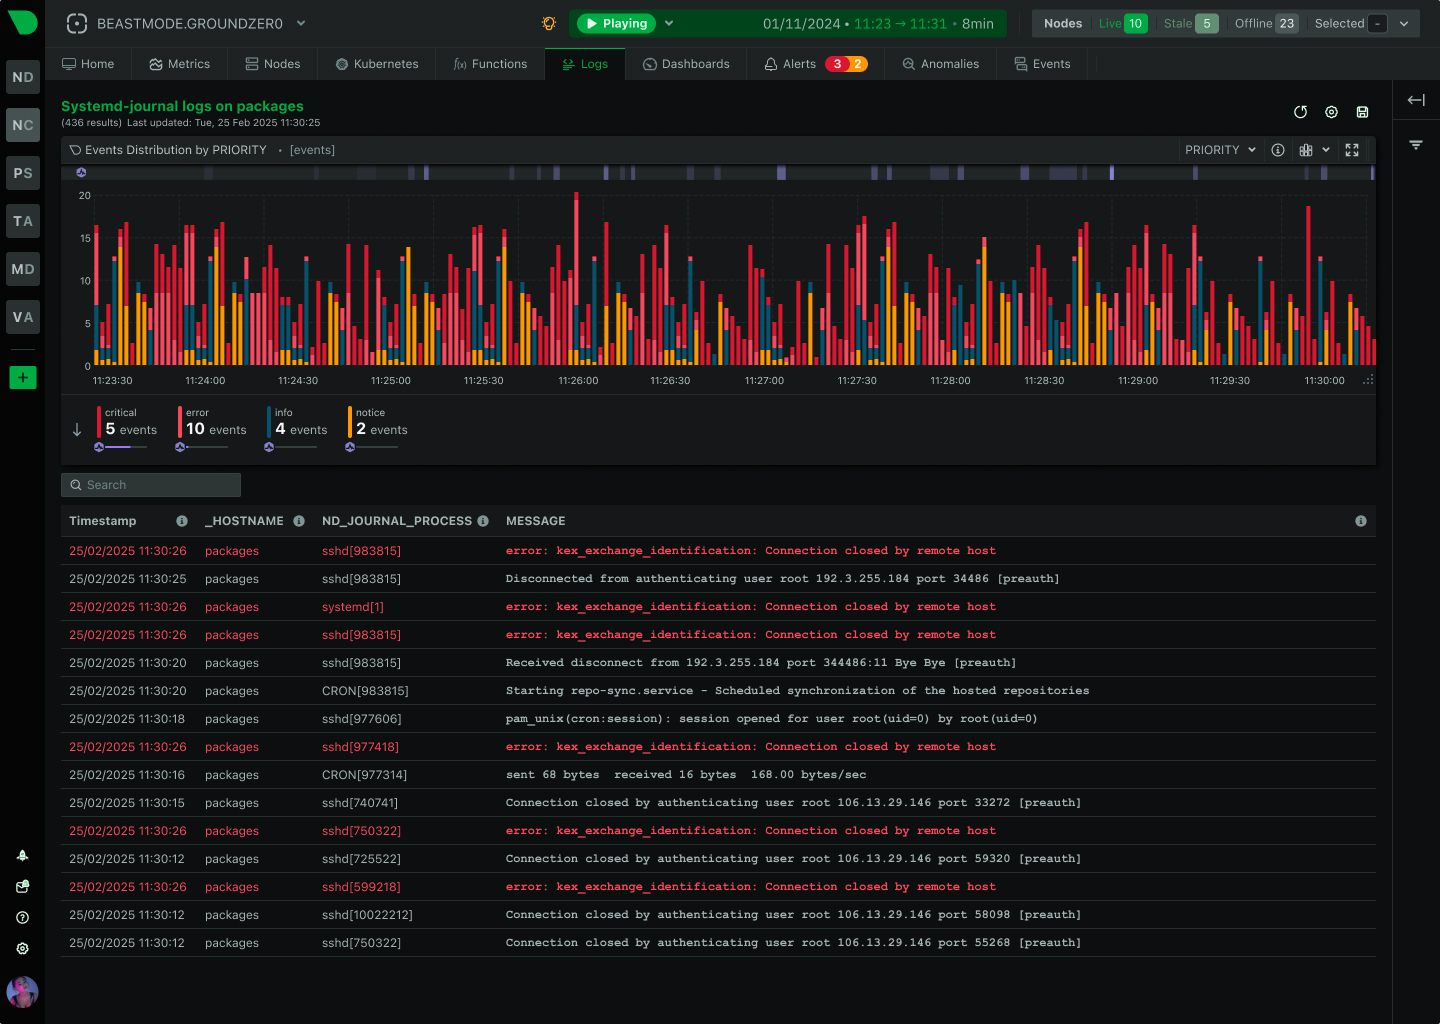
  • ML at the Edge: Each Netdata Agent trains hundreds of ML models on your metrics locally and in real-time. It learns the normal behavior of every single metric and automatically detects anomalies—the “unknown unknowns” that you would never think to write a rule for.
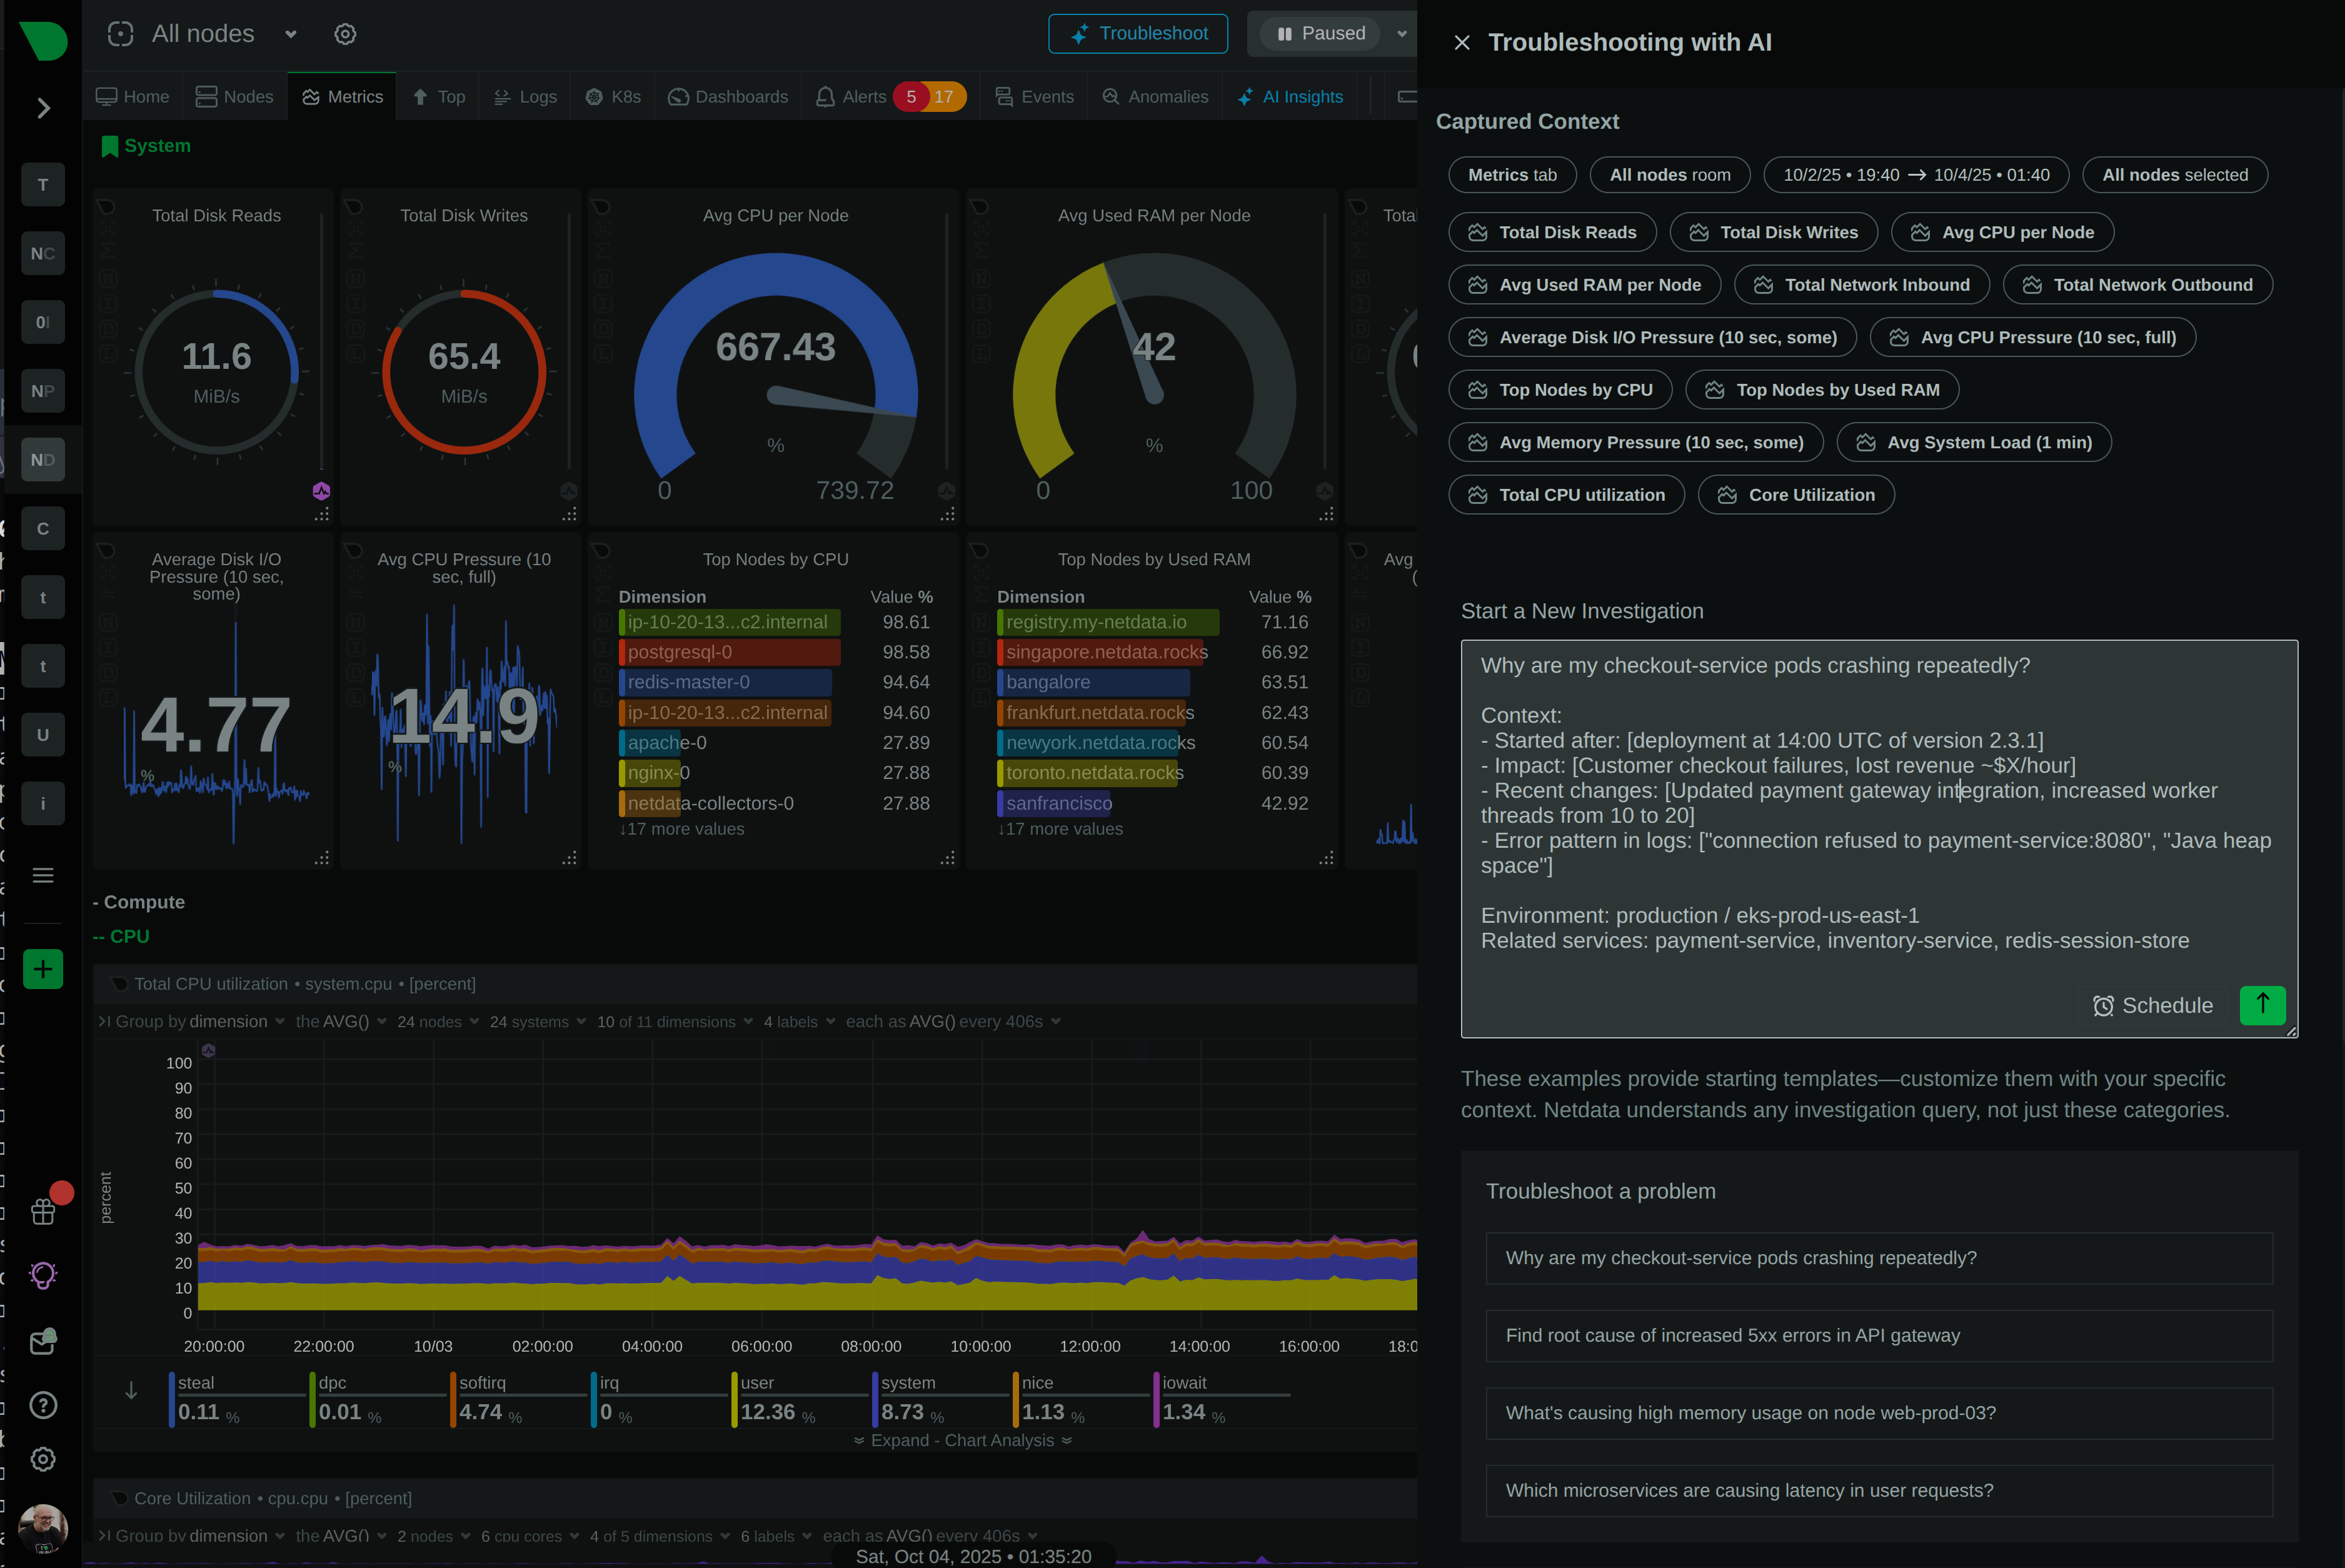
  • Agentic AI: When an anomaly is detected, Netdata’s AI doesn’t just send an alert. It acts as a co-engineer, automatically investigating the incident, correlating data, and providing reports that point to the likely root cause. You can even use conversational AI to ask questions about your infrastructure in plain English. This moves teams from reactive firefighting to proactive, intelligent problem-solving.

The User Experience: Integrated Dashboards vs. Grafana

The default Prometheus web UI is very basic and primarily used for ad-hoc queries. The standard practice is to pair Prometheus with Grafana for visualization. While Grafana is a powerful tool, it means you have another component to manage, and you must build every dashboard from scratch, which is a time-consuming process.

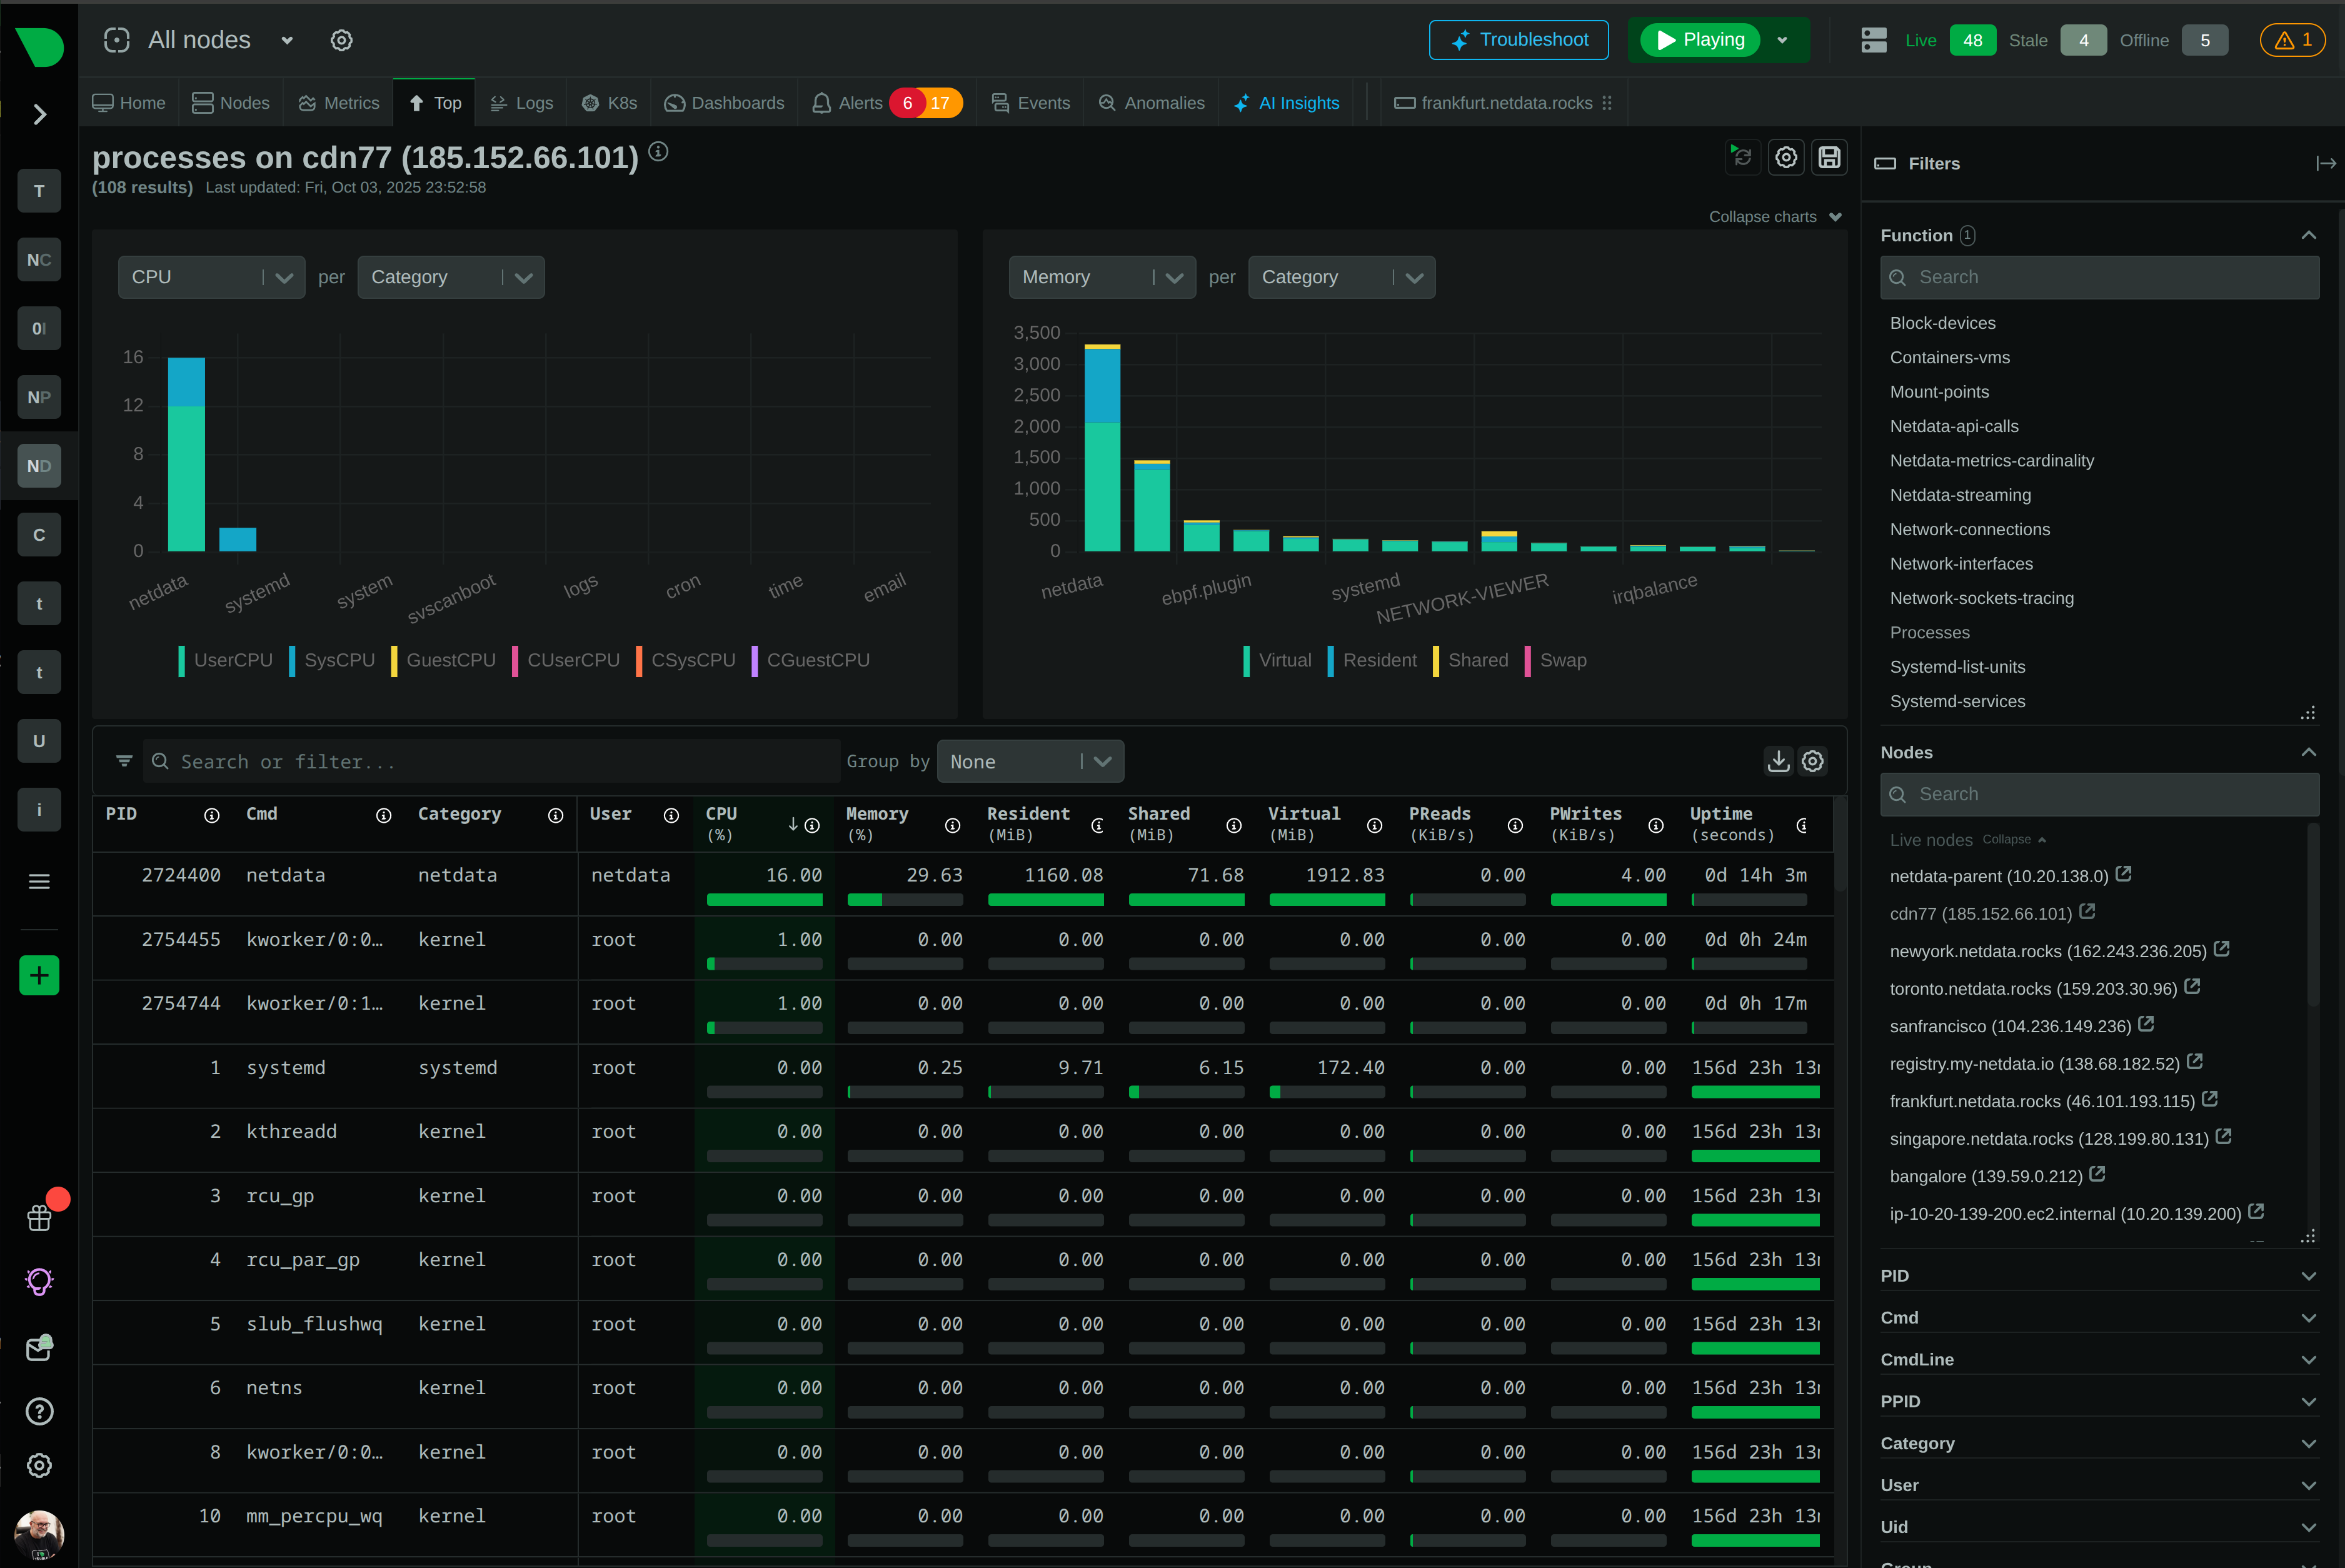
Netdata includes a sophisticated, interactive, and real-time dashboard out of the box. These dashboards are automatically generated and populated based on what the agent discovers. You can zoom, pan, and filter data across any time frame, all without writing a single line of a query language. This integrated experience dramatically speeds up troubleshooting by presenting relevant information in an intuitive format from the moment you start monitoring.

Why Engineers Choose Netdata Over Prometheus

Teams choose Netdata as a Prometheus alternative when they want to overcome the operational complexity and limitations of a traditional monitoring stack. Here’s why:

  1. To Eliminate Configuration Toil: SREs are tired of writing and maintaining YAML files for exporters and scrape configs. Netdata’s zero-configuration, auto-discovery model saves countless engineering hours and lets them focus on more valuable work.

  2. For True Real-Time Visibility: When troubleshooting a live incident, waiting 15-30 seconds for the next data point is not an option. Netdata’s per-second metrics provide the immediate feedback needed to resolve issues faster.

  3. To Move Beyond Static Alerts: Alert fatigue from poorly tuned rules is a common pain point. Netdata’s ML-powered anomaly detection automatically finds issues that rules-based systems miss, with far fewer false positives.

  4. To Simplify the Observability Stack: Managing Prometheus + Alertmanager + Grafana + long-term storage (like Thanos/Cortex) creates a complex, brittle system. Netdata provides a robust, integrated, and enterprise-grade solution in a single platform.

  5. For Actionable, AI-Driven Insights: Instead of just getting a chart and an alert, engineers want answers. Netdata’s Agentic AI provides automated root cause analysis, turning hours of manual correlation into an instant insight.

Netdata vs Prometheus - Summary

Prometheus remains a powerful and flexible tool, especially for teams with the dedicated resources to build, configure, and maintain a custom monitoring stack around it. It is a solid choice if you value ultimate composability and have deep expertise in PromQL.

Netdata is the superior Prometheus alternative for modern teams who prioritize speed, efficiency, and intelligence. If you need immediate, high-granularity insights, want to reduce monitoring complexity, and wish to leverage AI to automate troubleshooting, Netdata offers a more complete and powerful solution right out of the box.

Try Netdata! The Best Prometheus Alternative

Ready to experience monitoring that is instant, intelligent, and effortless? Stop wrestling with configuration files and start getting real-time answers. Netdata is the fastest path to full-stack observability, even for lean teams.

Start Your Free Netdata Trial

Netdata vs Prometheus FAQs

Is it easy to migrate from Prometheus to Netdata? Yes. Migrating is straightforward. You can run Netdata alongside your existing Prometheus setup to compare. Netdata can even be configured to scrape Prometheus exporter endpoints, allowing you to centralize all your metrics within Netdata’s real-time dashboards and leverage its AI capabilities on your existing data streams.

Can Netdata replace Grafana? For many real-time infrastructure troubleshooting and visualization use cases, yes. Netdata provides rich, interactive, and auto-generated dashboards that eliminate the need to build and maintain them in Grafana. While Grafana is excellent for building custom, cross-source business intelligence dashboards, Netdata is faster and more efficient for immediate operational visibility.

Does Netdata integrate with my existing tech stack? Absolutely. Netdata auto-discovers and collects metrics from hundreds of services, applications, and system components, including Kubernetes, Docker, popular databases, web servers, and more. It also supports standard collection protocols like StatsD and can scrape Prometheus endpoints, ensuring it fits seamlessly into your environment.

Which tool is more scalable for growing businesses? Both tools can be scaled to handle massive environments, but they do so differently. Scaling Prometheus often requires adding federated components like Thanos or Cortex, which adds complexity. Netdata is designed for scalability with its distributed architecture and efficient parent-child streaming configurations. Its edge-based processing model naturally reduces the load on the central components, making it simpler to scale horizontally.

Which tool is better for Kubernetes monitoring? Both are strong choices for Kubernetes. However, Netdata offers a significant advantage in time-to-value. With a single Helm chart installation, Netdata automatically discovers all nodes, pods, and containers, providing pre-built, per-pod dashboards and ML-based anomaly detection without the extensive setup required to get a similar level of visibility with a Prometheus and Grafana stack.

Discover More