Paessler PRTG vs Netdata: Which Monitoring Solution Is Right for You?

A comprehensive comparison of features, pricing, and capabilities

Paessler PRTG vs Netdata: Which Monitoring Solution Is Right for You?

Choosing the right infrastructure monitoring tool is a critical decision that directly impacts your team’s ability to maintain system health, troubleshoot issues, and ensure performance. Paessler PRTG has long been a staple in traditional IT environments, known for its sensor-based approach. Netdata, on the other hand, offers a modern, real-time, and AI-powered observability platform designed for today’s complex and dynamic systems.

This guide provides an in-depth, side-by-side comparison of Paessler PRTG and Netdata to help you understand which solution is the better fit for your operational needs, budget, and technical environment. We’ll examine everything from data granularity and pricing models to ease of use and scalability.

Quick Comparison Table

Feature Paessler PRTG Netdata
Data Granularity Typically 60 seconds (configurable, impacts performance) Per-second by default
Pricing Model Per-sensor (can become complex and costly) ✅ Per-node (transparent and predictable)
Primary Use Case Network and traditional IT monitoring ✅ Full-stack, real-time infrastructure observability
Setup & Discovery Manual sensor configuration ✅ Zero-configuration, automatic discovery
AI/ML Capabilities Basic threshold-based alerting ✅ Unsupervised ML on the edge & Agentic AI
Scalability Centralized core server, can bottleneck ✅ Distributed, horizontal scaling
Core Platform Windows Server required ✅ Linux, macOS, Containers, FreeBSD (Windows via WSL)
Open Source Proprietary ✅ Yes

What Is Netdata?

Netdata is an enterprise-grade, open-source observability platform that provides real-time, high-granularity insights into the health and performance of your entire infrastructure. Designed for DevOps engineers, SREs, and IT professionals, Netdata simplifies monitoring by eliminating complexity. It combines per-second metric collection with a powerful AI engine to help teams detect, troubleshoot, and resolve issues faster than ever before.

With Netdata, you get a solution built for modern challenges. Its key benefits include:

  • Instant, Per-Second Insights: Troubleshoot effectively with real-time data, eliminating the blind spots left by slower polling intervals.
  • Zero-Configuration Deployment: The Netdata Agent automatically discovers and monitors thousands of metrics from your systems, applications, and containers right after installation.
  • AI-Powered Troubleshooting: Leverage unsupervised machine learning at the edge to detect anomalies automatically and use Agentic AI to investigate issues, identify root causes, and suggest solutions.
  • Unmatched Efficiency: Netdata is engineered for minimal resource consumption, allowing you to monitor thousands of nodes without impacting system performance.
  • Distributed by Design: Data is processed at the edge, on your nodes, ensuring security and reducing network overhead. Your data stays with you.

What Is Paessler PRTG?

Paessler PRTG Network Monitor is a well-established, all-in-one monitoring solution primarily aimed at IT administrators and network engineers. It uses a sensor-based model to collect data from a wide range of devices, including routers, switches, servers, and applications. PRTG is known for its extensive support for protocols like SNMP, WMI, and NetFlow.

Its key features include a centralized web interface, customizable dashboards, a flexible alerting system, and in-depth reporting capabilities. PRTG is often favored in traditional, Windows-centric IT environments for its comprehensive approach to network and server monitoring. However, its architecture and pricing model present challenges for teams managing dynamic, cloud-native infrastructures.

Key Differences Between Netdata & Paessler PRTG

While both tools aim to provide visibility into infrastructure, their philosophies and architectures lead to significant differences in functionality, cost, and user experience.

Features & Functionality

The most striking difference lies in data granularity and intelligence. Netdata collects metrics every second, providing an unparalleled level of detail crucial for diagnosing transient, hard-to-catch issues in modern applications. PRTG typically polls data every 60 seconds. While this can be adjusted, lowering the interval significantly increases the load on both the monitored device and the central PRTG core server, which can quickly become a performance bottleneck.

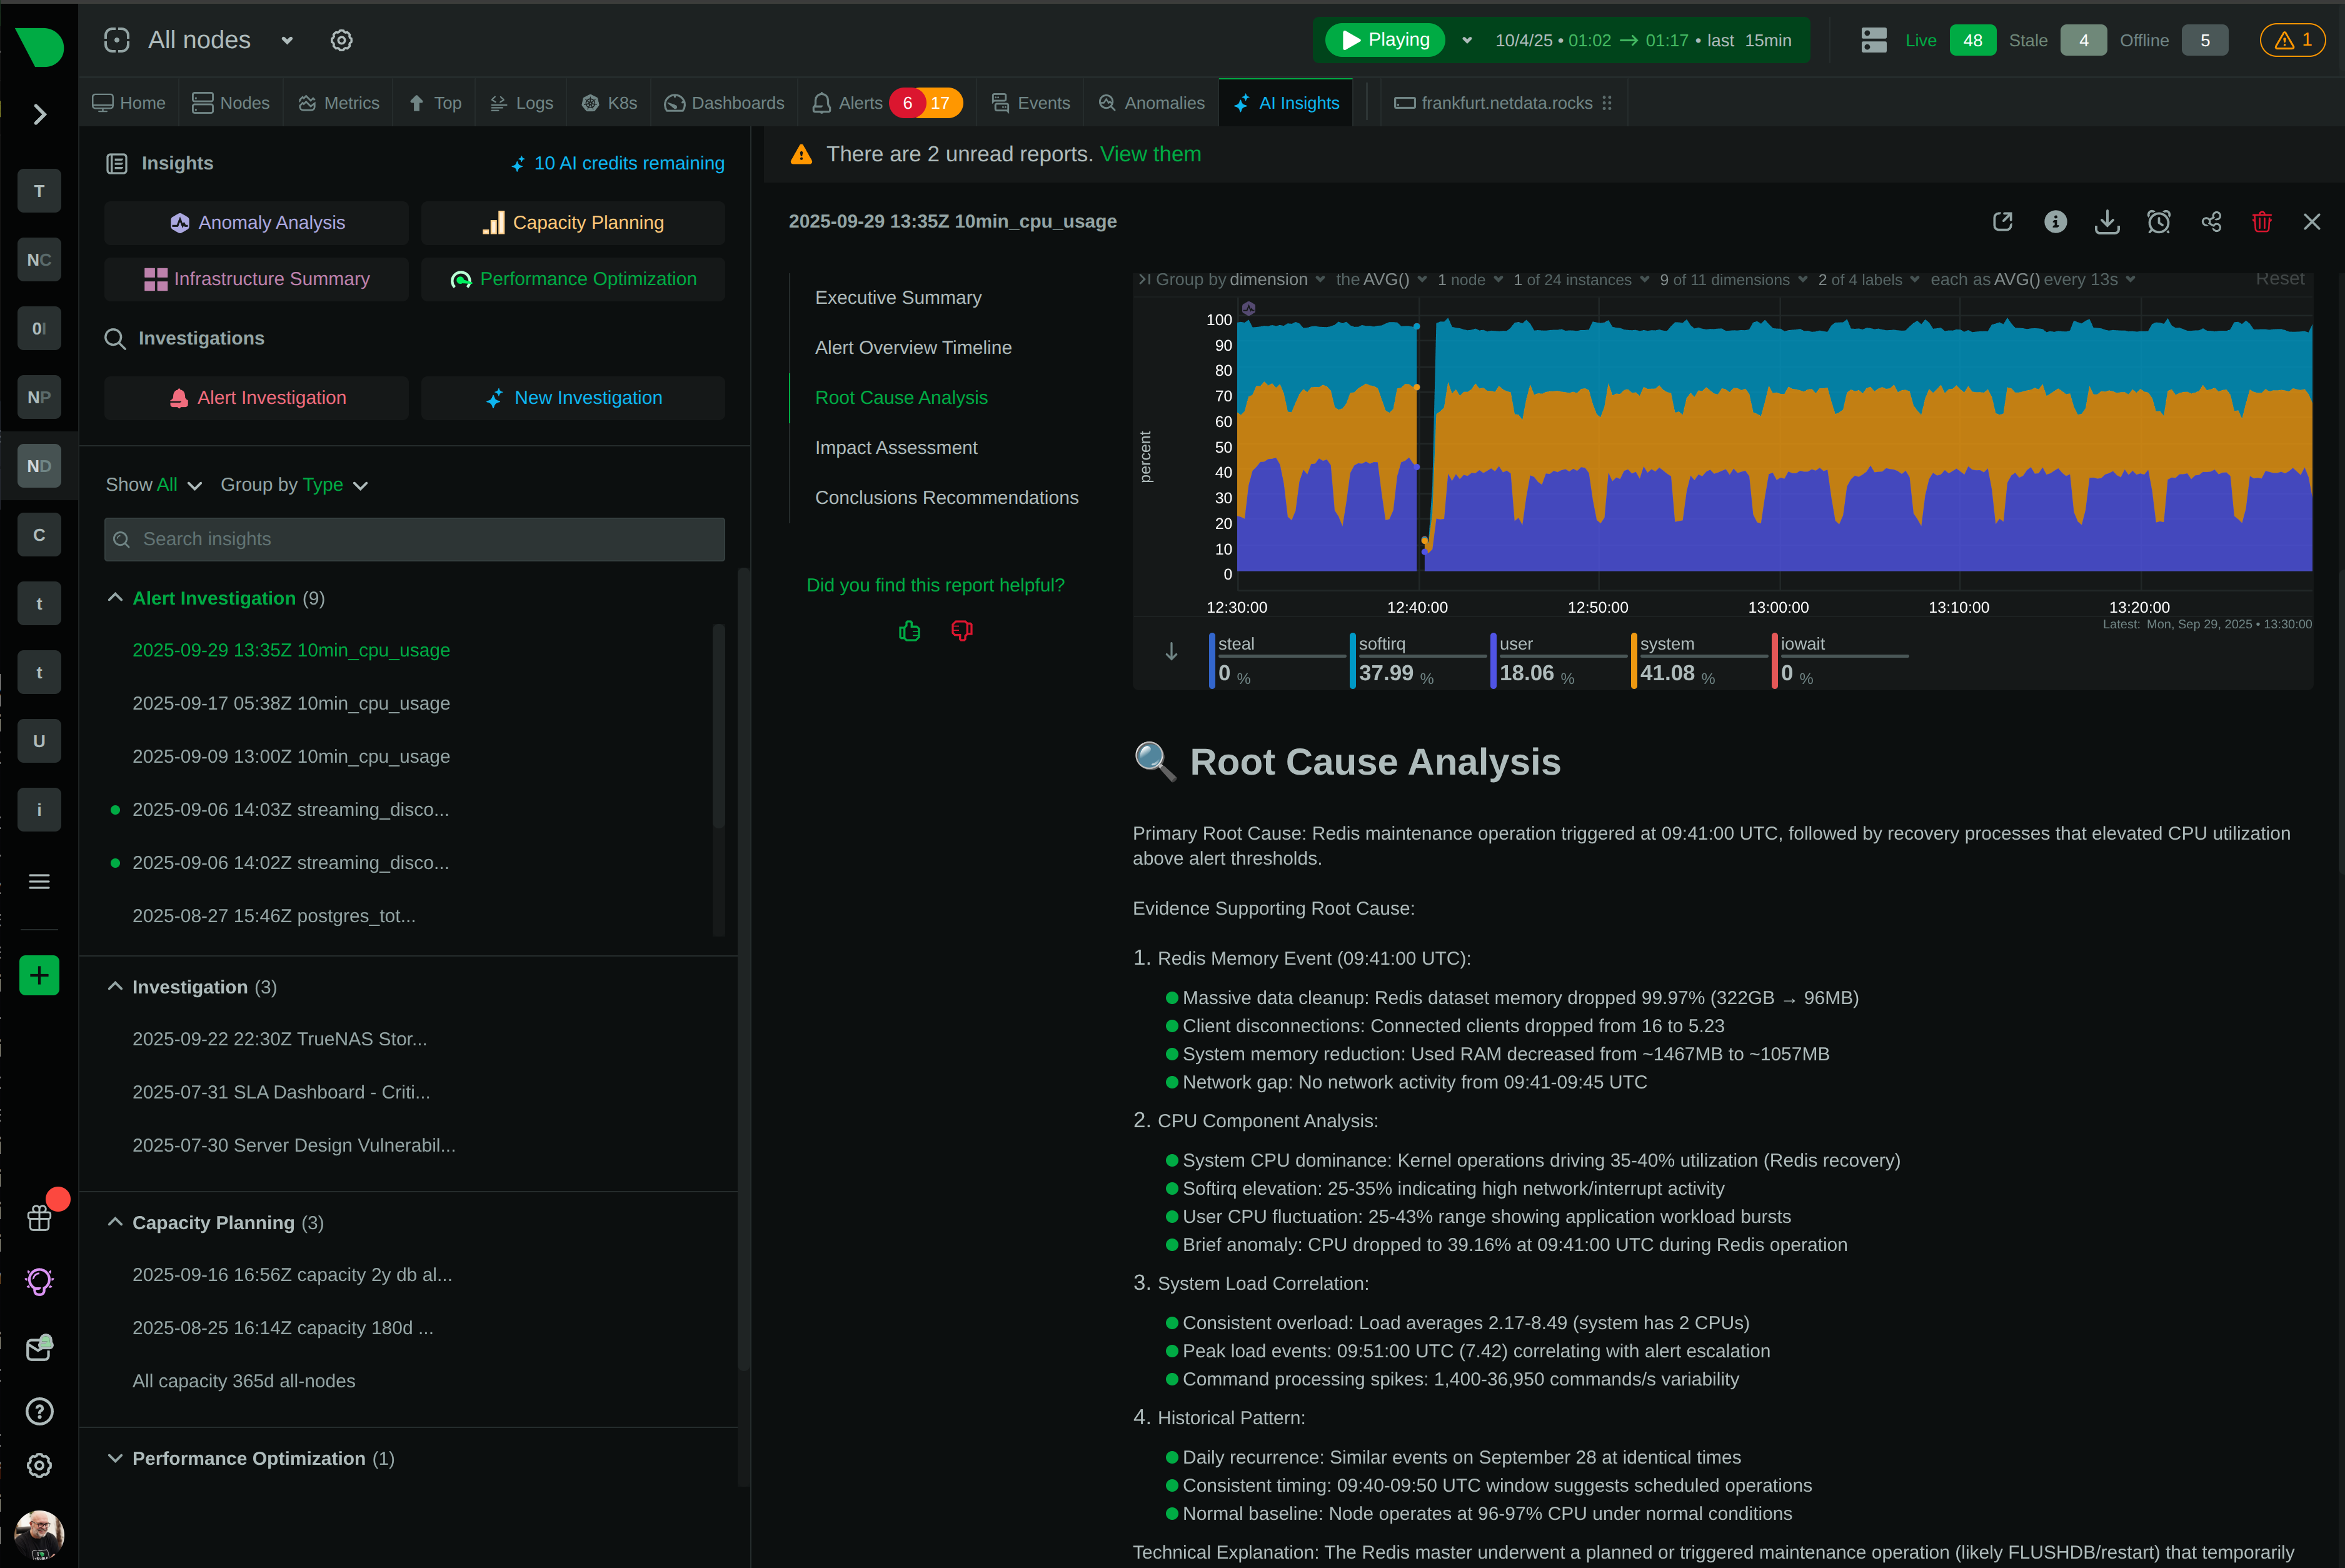
Furthermore, Netdata’s approach to issue detection is fundamentally more advanced. It employs unsupervised machine learning models on each node to automatically learn normal behavior and flag anomalies without manual configuration. This proactive approach contrasts sharply with PRTG’s reliance on static, manually configured thresholds (e.g., “alert if CPU is over 90%"). This old method often leads to alert fatigue or, worse, missed incidents that don’t fit a predefined rule. With the addition of Netdata AI, users can conversationally query their infrastructure, asking for automated root cause analysis reports, turning hours of manual investigation into minutes of AI-driven discovery.

Pricing

Pricing is a major differentiator and a common pain point for PRTG users. PRTG’s licensing is based on the number of “sensors” you use. A sensor is a single aspect you monitor on a device—like CPU load, a specific network port’s traffic, or free disk space. A single server can easily consume 20-50 sensors, and the costs escalate quickly and unpredictably as your infrastructure grows.

Netdata offers a simple, transparent per-node pricing model. A node is any system you monitor, regardless of how many metrics are collected from it. This predictable model aligns with how modern infrastructure scales and eliminates the overhead of counting and managing sensors. You can monitor everything on a node for one flat price, making it far more cost-effective for comprehensive, full-stack observability.

Integrations & Compatibility

PRTG has deep roots in the Windows ecosystem and excels at monitoring network hardware via SNMP. Its strength lies in traditional IT environments. However, its core server must run on a Windows machine, which can be a significant limitation for DevOps teams operating primarily on Linux and in containerized environments.

Netdata is built for the modern, heterogeneous stack. The agent is lightweight and runs natively on Linux, macOS, FreeBSD, and inside containers. It automatically discovers and configures integrations for hundreds of applications and services, from web servers like Nginx to databases like PostgreSQL and container platforms like Kubernetes. This “zero-config” approach saves countless hours compared to PRTG’s manual process of adding and configuring each sensor.

Customer Support & Reliability

Both platforms offer enterprise support plans and have extensive documentation. PRTG provides a traditional corporate support structure. Netdata complements its enterprise support with a vibrant and active open-source community on GitHub and its forums, providing a valuable resource for collaboration and quick solutions.

From a reliability perspective, Netdata’s distributed architecture offers inherent advantages. Since data processing happens at the edge, there is no single point of failure that can take down your entire monitoring system. PRTG’s centralized model means that if the core server goes down, all monitoring, alerting, and data collection stops.

Why Engineers Choose Netdata Over Paessler PRTG

Engineers and SREs are increasingly choosing Netdata as a PRTG alternative for several key reasons that address the limitations of traditional monitoring:

  1. Escape the Sensor Tax: The frustration with PRTG’s sensor-based pricing is real. Teams feel penalized for wanting deeper visibility. Netdata’s predictable per-node pricing encourages comprehensive monitoring, rather than forcing you to pick and choose metrics to stay within a budget.
  2. See Problems in Real-Time: A 60-second polling interval is too slow for the dynamic nature of microservices and containers. An issue can appear and disappear between polls, leaving you with no data to diagnose it. Netdata’s per-second metrics ensure you see everything, as it happens.
  3. Embrace Automation, Not Manual Toil: Setting up a new server with PRTG involves a manual checklist of adding the right sensors. With Netdata, you just install the agent. It automatically discovers everything—from system metrics and running applications to Docker containers—and starts monitoring immediately.
  4. Proactive AI Over Reactive Alerts: Instead of spending time tuning noisy threshold alerts, let Netdata’s AI do the work. Its ML engine finds anomalies you weren’t looking for, helping you prevent outages instead of just reacting to them.
  5. Built for the Modern Stack: If your infrastructure is built on Linux, Kubernetes, and cloud services, you need a tool that speaks that language fluently. Netdata is cloud-native and open-source, designed from the ground up for the complexities of today’s systems.

Paessler PRTG vs Netdata - Summary

Choosing between Paessler PRTG and Netdata comes down to your infrastructure and your monitoring philosophy.

Paessler PRTG may be a suitable choice for organizations with a static, primarily Windows-based IT environment, where network device monitoring via SNMP is the top priority and per-minute data granularity is sufficient.

Netdata is the definitive choice for modern DevOps, SRE, and IT teams managing dynamic, complex, and heterogeneous systems. If you need real-time per-second visibility, automated discovery, proactive AI-driven insights, and a predictable cost model that scales with your infrastructure, Netdata is the superior Paessler PRTG alternative.

Try Netdata! The Best Paessler PRTG Alternative

Ready to move beyond sensor counting and reactive alerts? Experience the power of real-time, AI-assisted observability. With Netdata, you can stop firefighting and start engineering with confidence.

Start Your Free Trial

Netdata vs Paessler PRTG FAQs

Is it easy to migrate from Paessler PRTG to Netdata? Yes, migrating is straightforward. You can install the Netdata Agent alongside your existing PRTG setup to run them in parallel during the transition. Netdata’s agent automatically discovers services and metrics that you may have spent hours manually configuring in PRTG, making the switch incredibly efficient.

Does Netdata integrate with my existing tech stack? Absolutely. Netdata features hundreds of zero-configuration integrations for popular applications, databases, containers, and services. It excels in cloud-native environments like Kubernetes and Docker and provides deep visibility into Linux systems, complementing and often surpassing the monitoring capabilities of PRTG.

Will I lose data when switching from Paessler PRTG to Netdata? No, you will not lose any historical data. Since you can run Netdata and PRTG at the same time, your PRTG instance will continue collecting data until you are ready to decommission it. Once installed, Netdata will immediately begin collecting new, high-fidelity, per-second metrics for a much richer dataset moving forward.

Does Netdata offer migration assistance or tools? While there isn’t a direct “PRTG-to-Netdata” configuration converter, our comprehensive documentation and active community provide excellent support. The beauty of Netdata is that you don’t need to replicate PRTG’s manual configuration; its auto-discovery capability handles the heavy lifting for you.

Which tool is more scalable for growing businesses? Netdata is architected for scalability. Its distributed, edge-based model ensures that processing load is spread across your infrastructure, preventing central bottlenecks. PRTG’s centralized core server architecture can struggle as the number of sensors and probes grows, often requiring significant hardware upgrades to maintain performance. For growing businesses, Netdata’s scalable design offers a more robust and cost-effective path forward.

Discover More