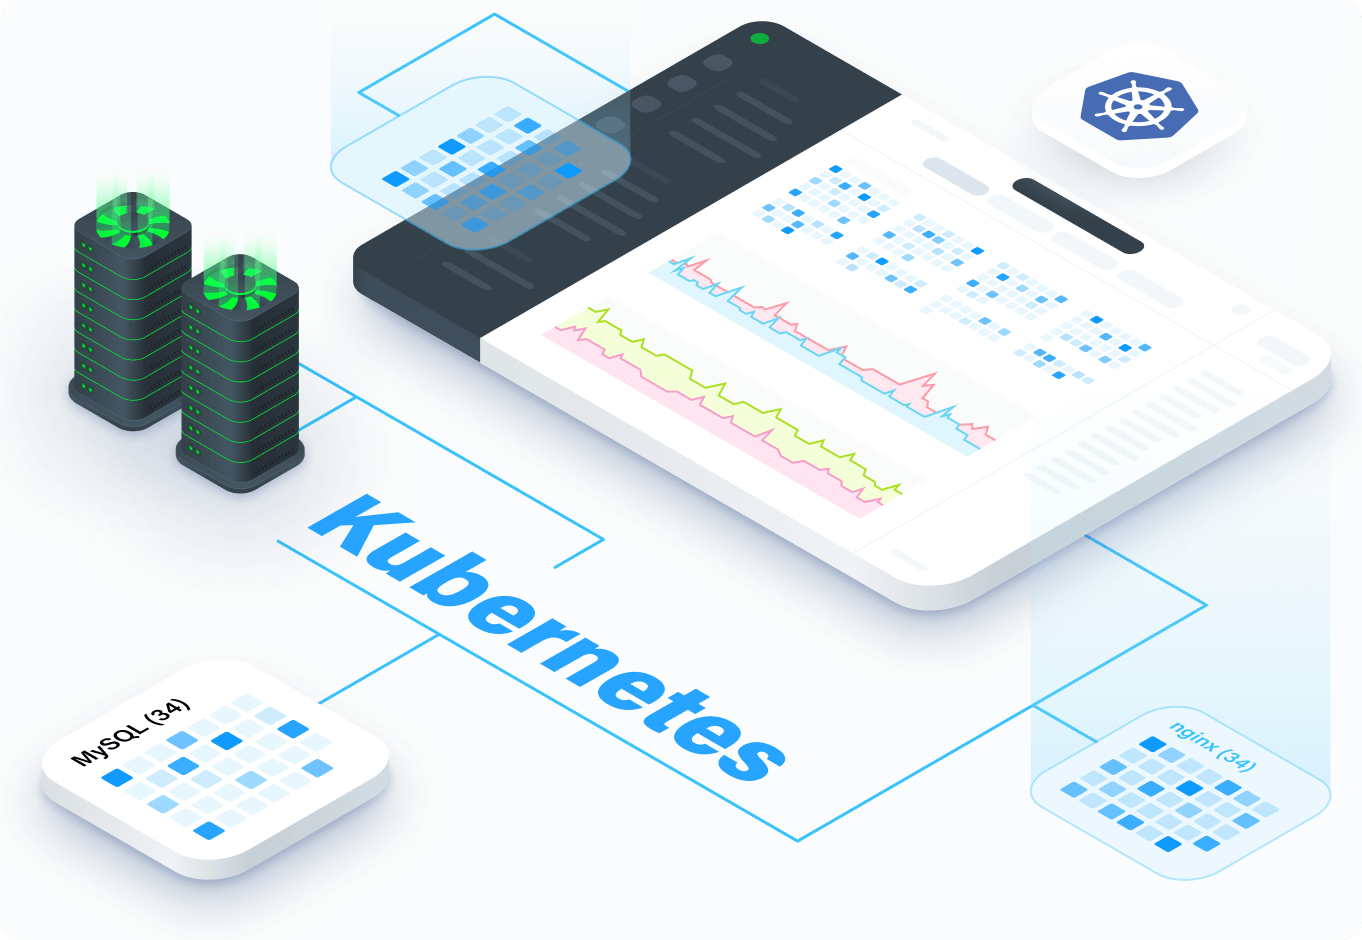
Adapt monitoring to a multilayered Kubernetes deployment
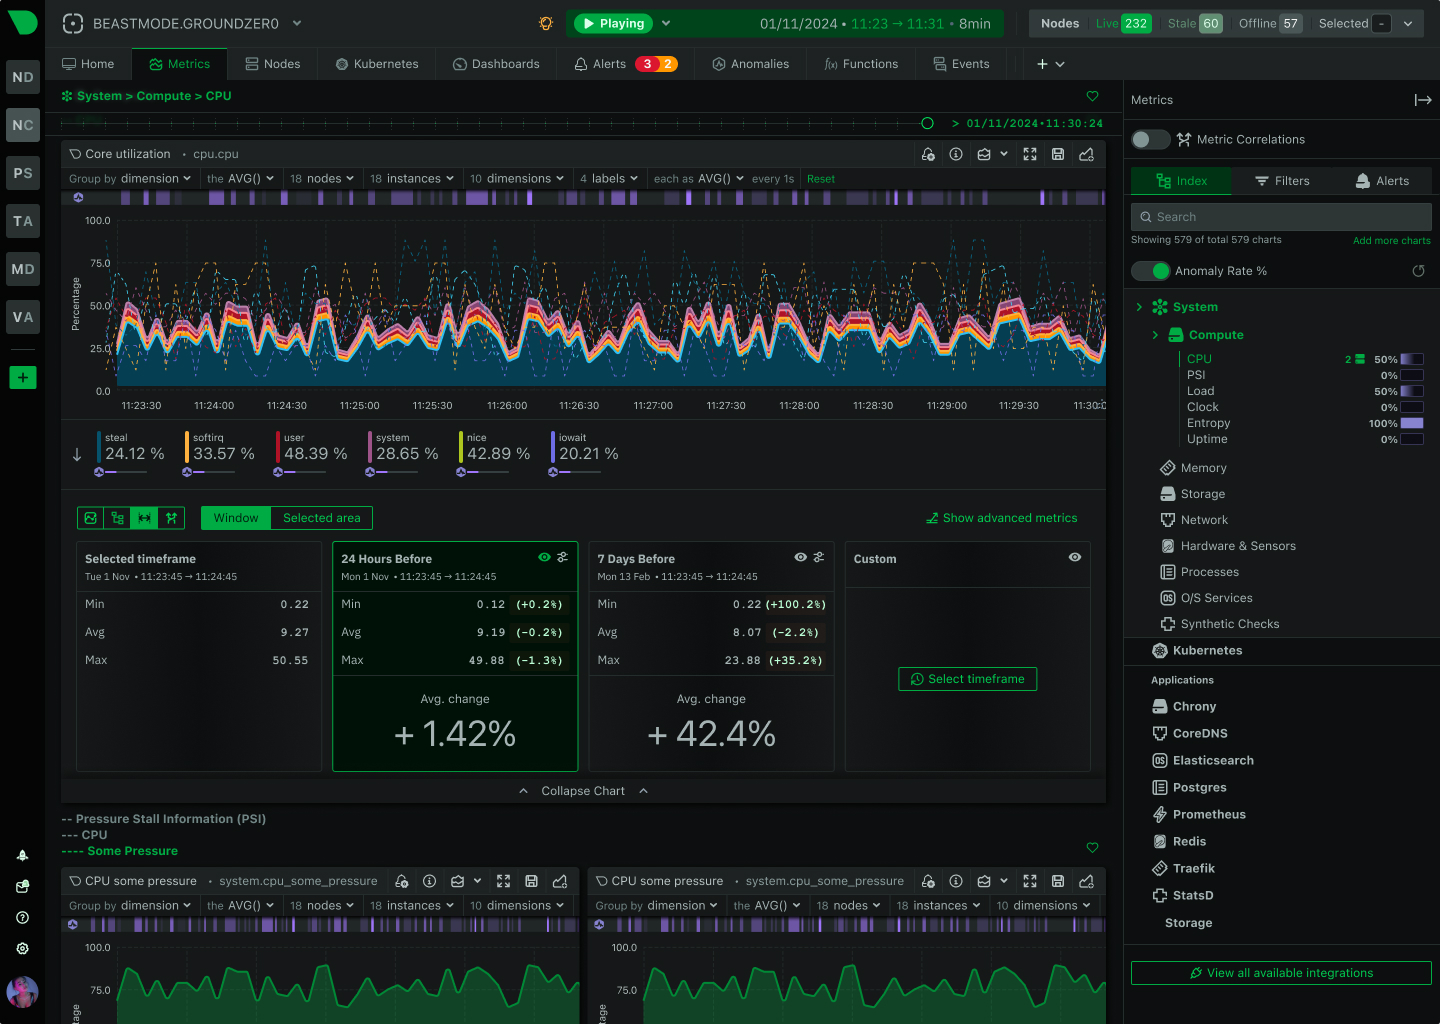
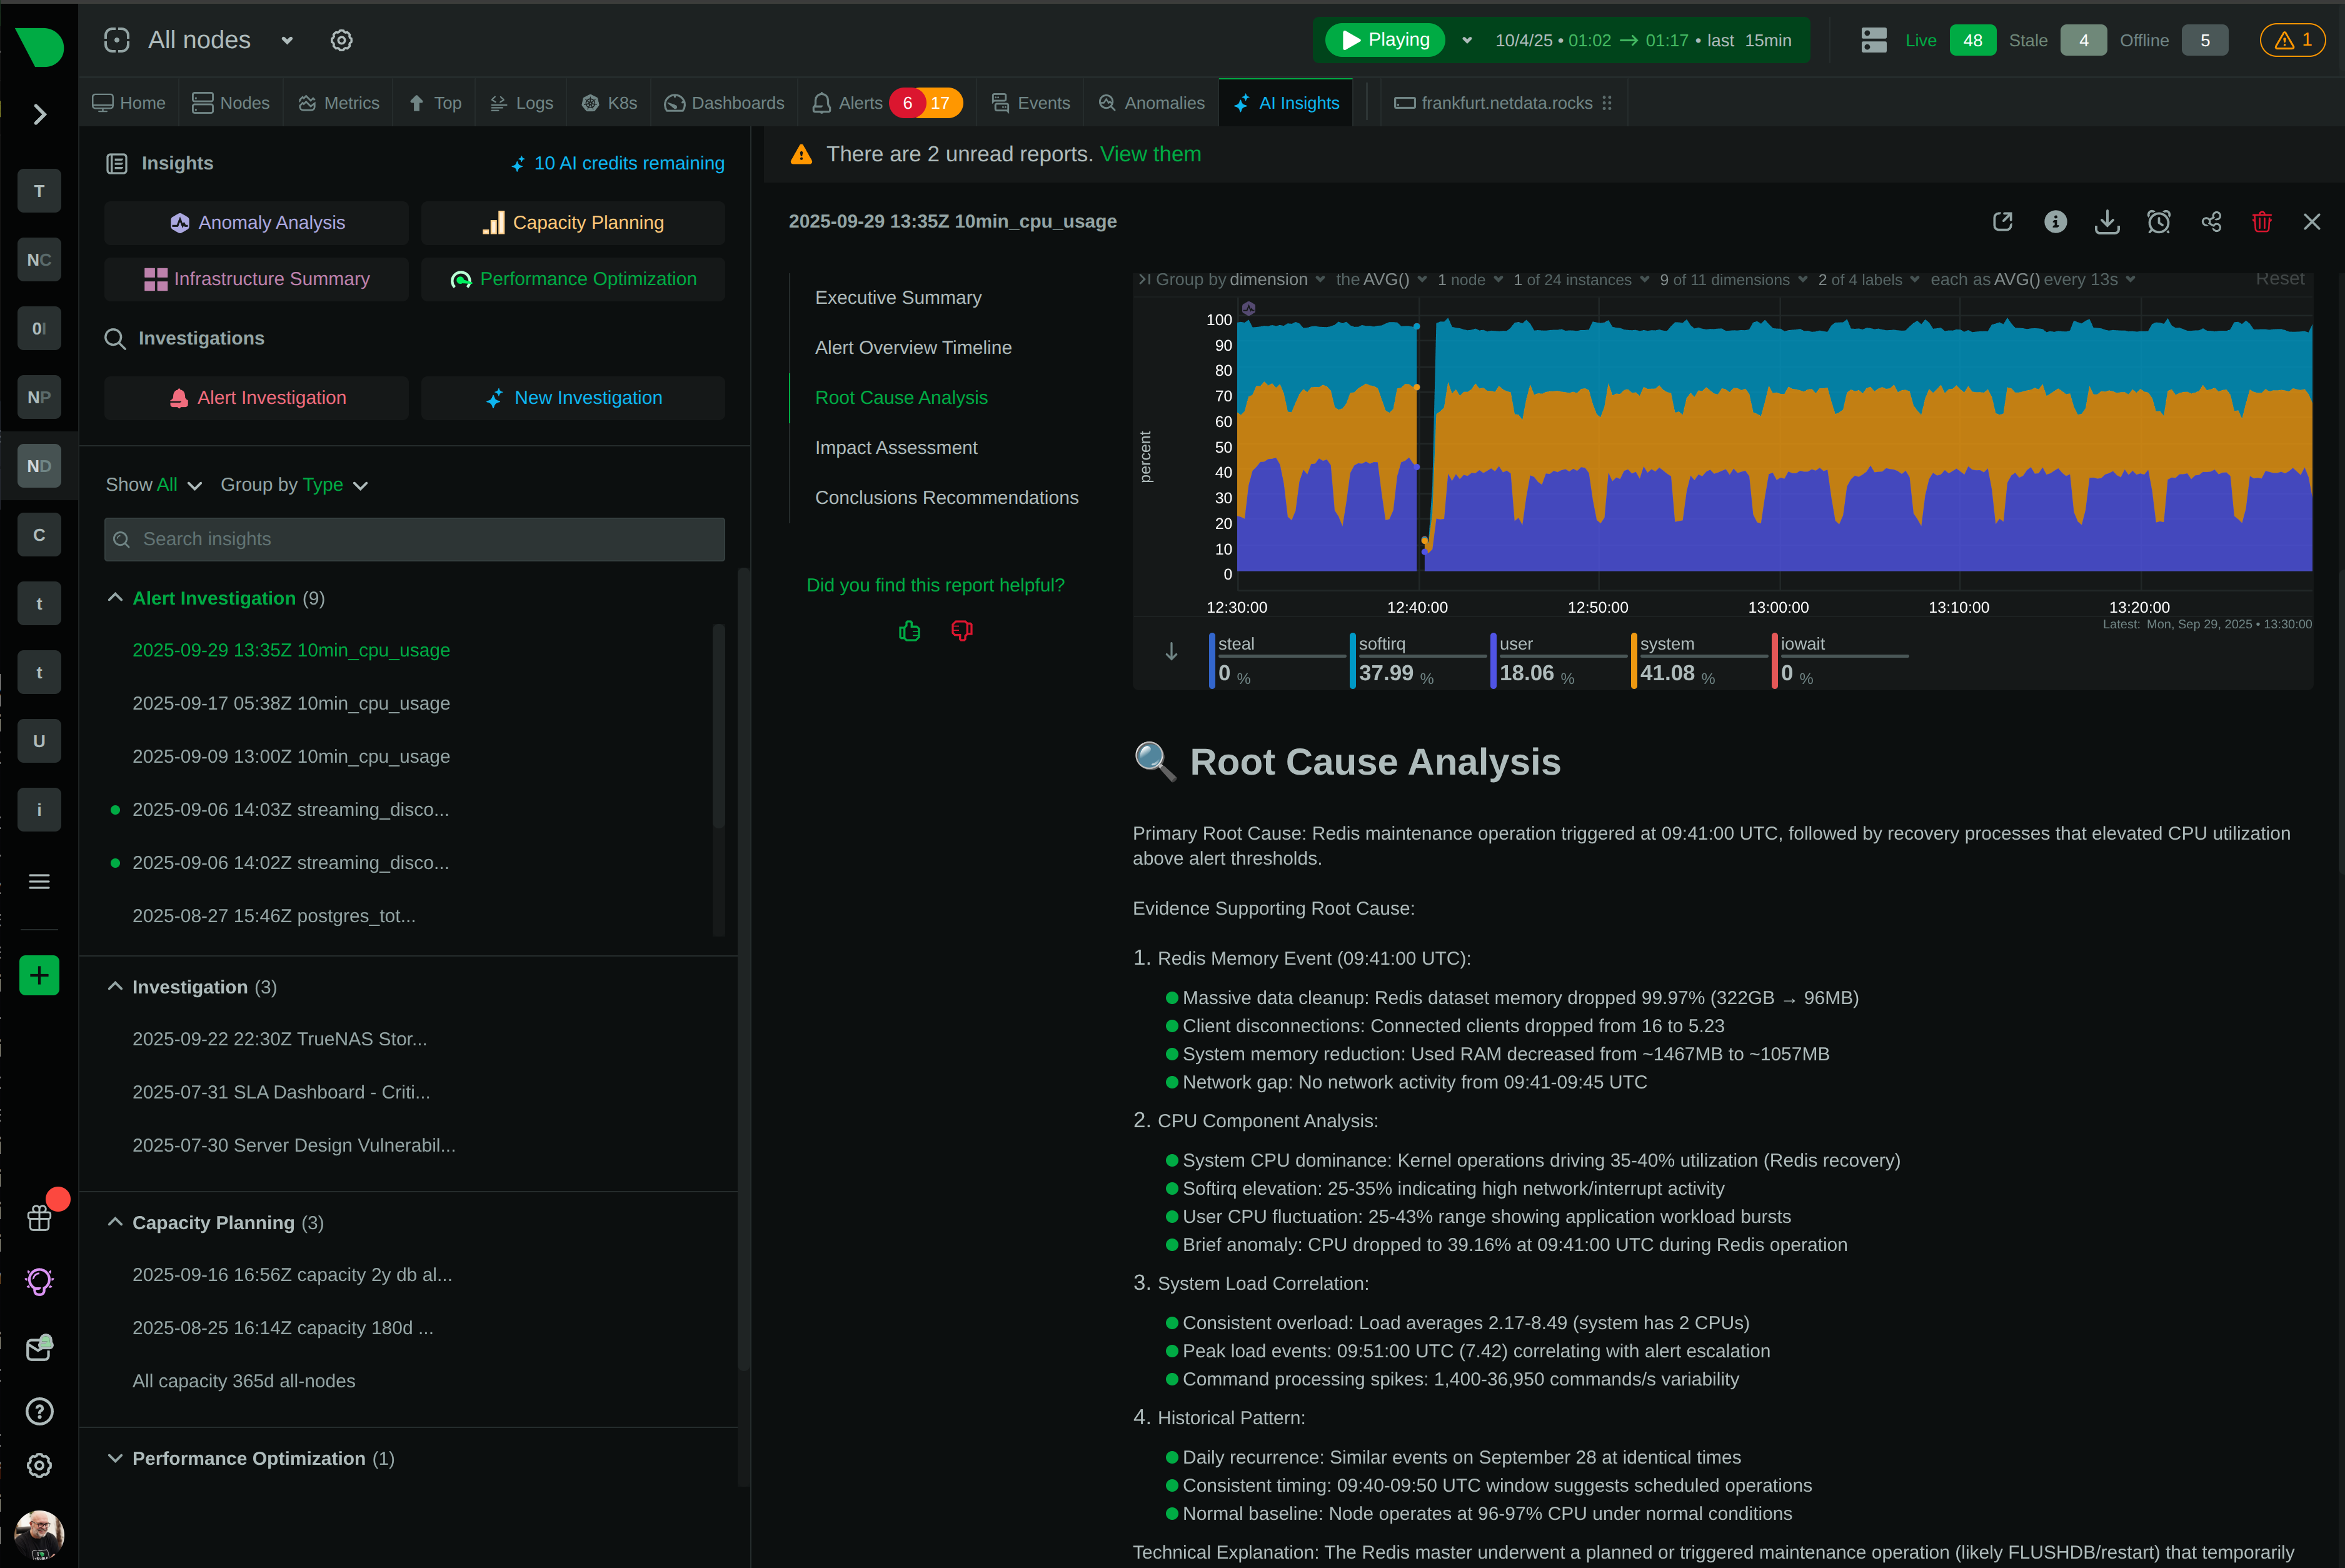
To understand the true performance and availability of an application, you need impact analysis for every layer of your Kubernetes cluster. Keep up with the Kubernetes chaos with rich context, intuitive visualizations, and single-second granularity.
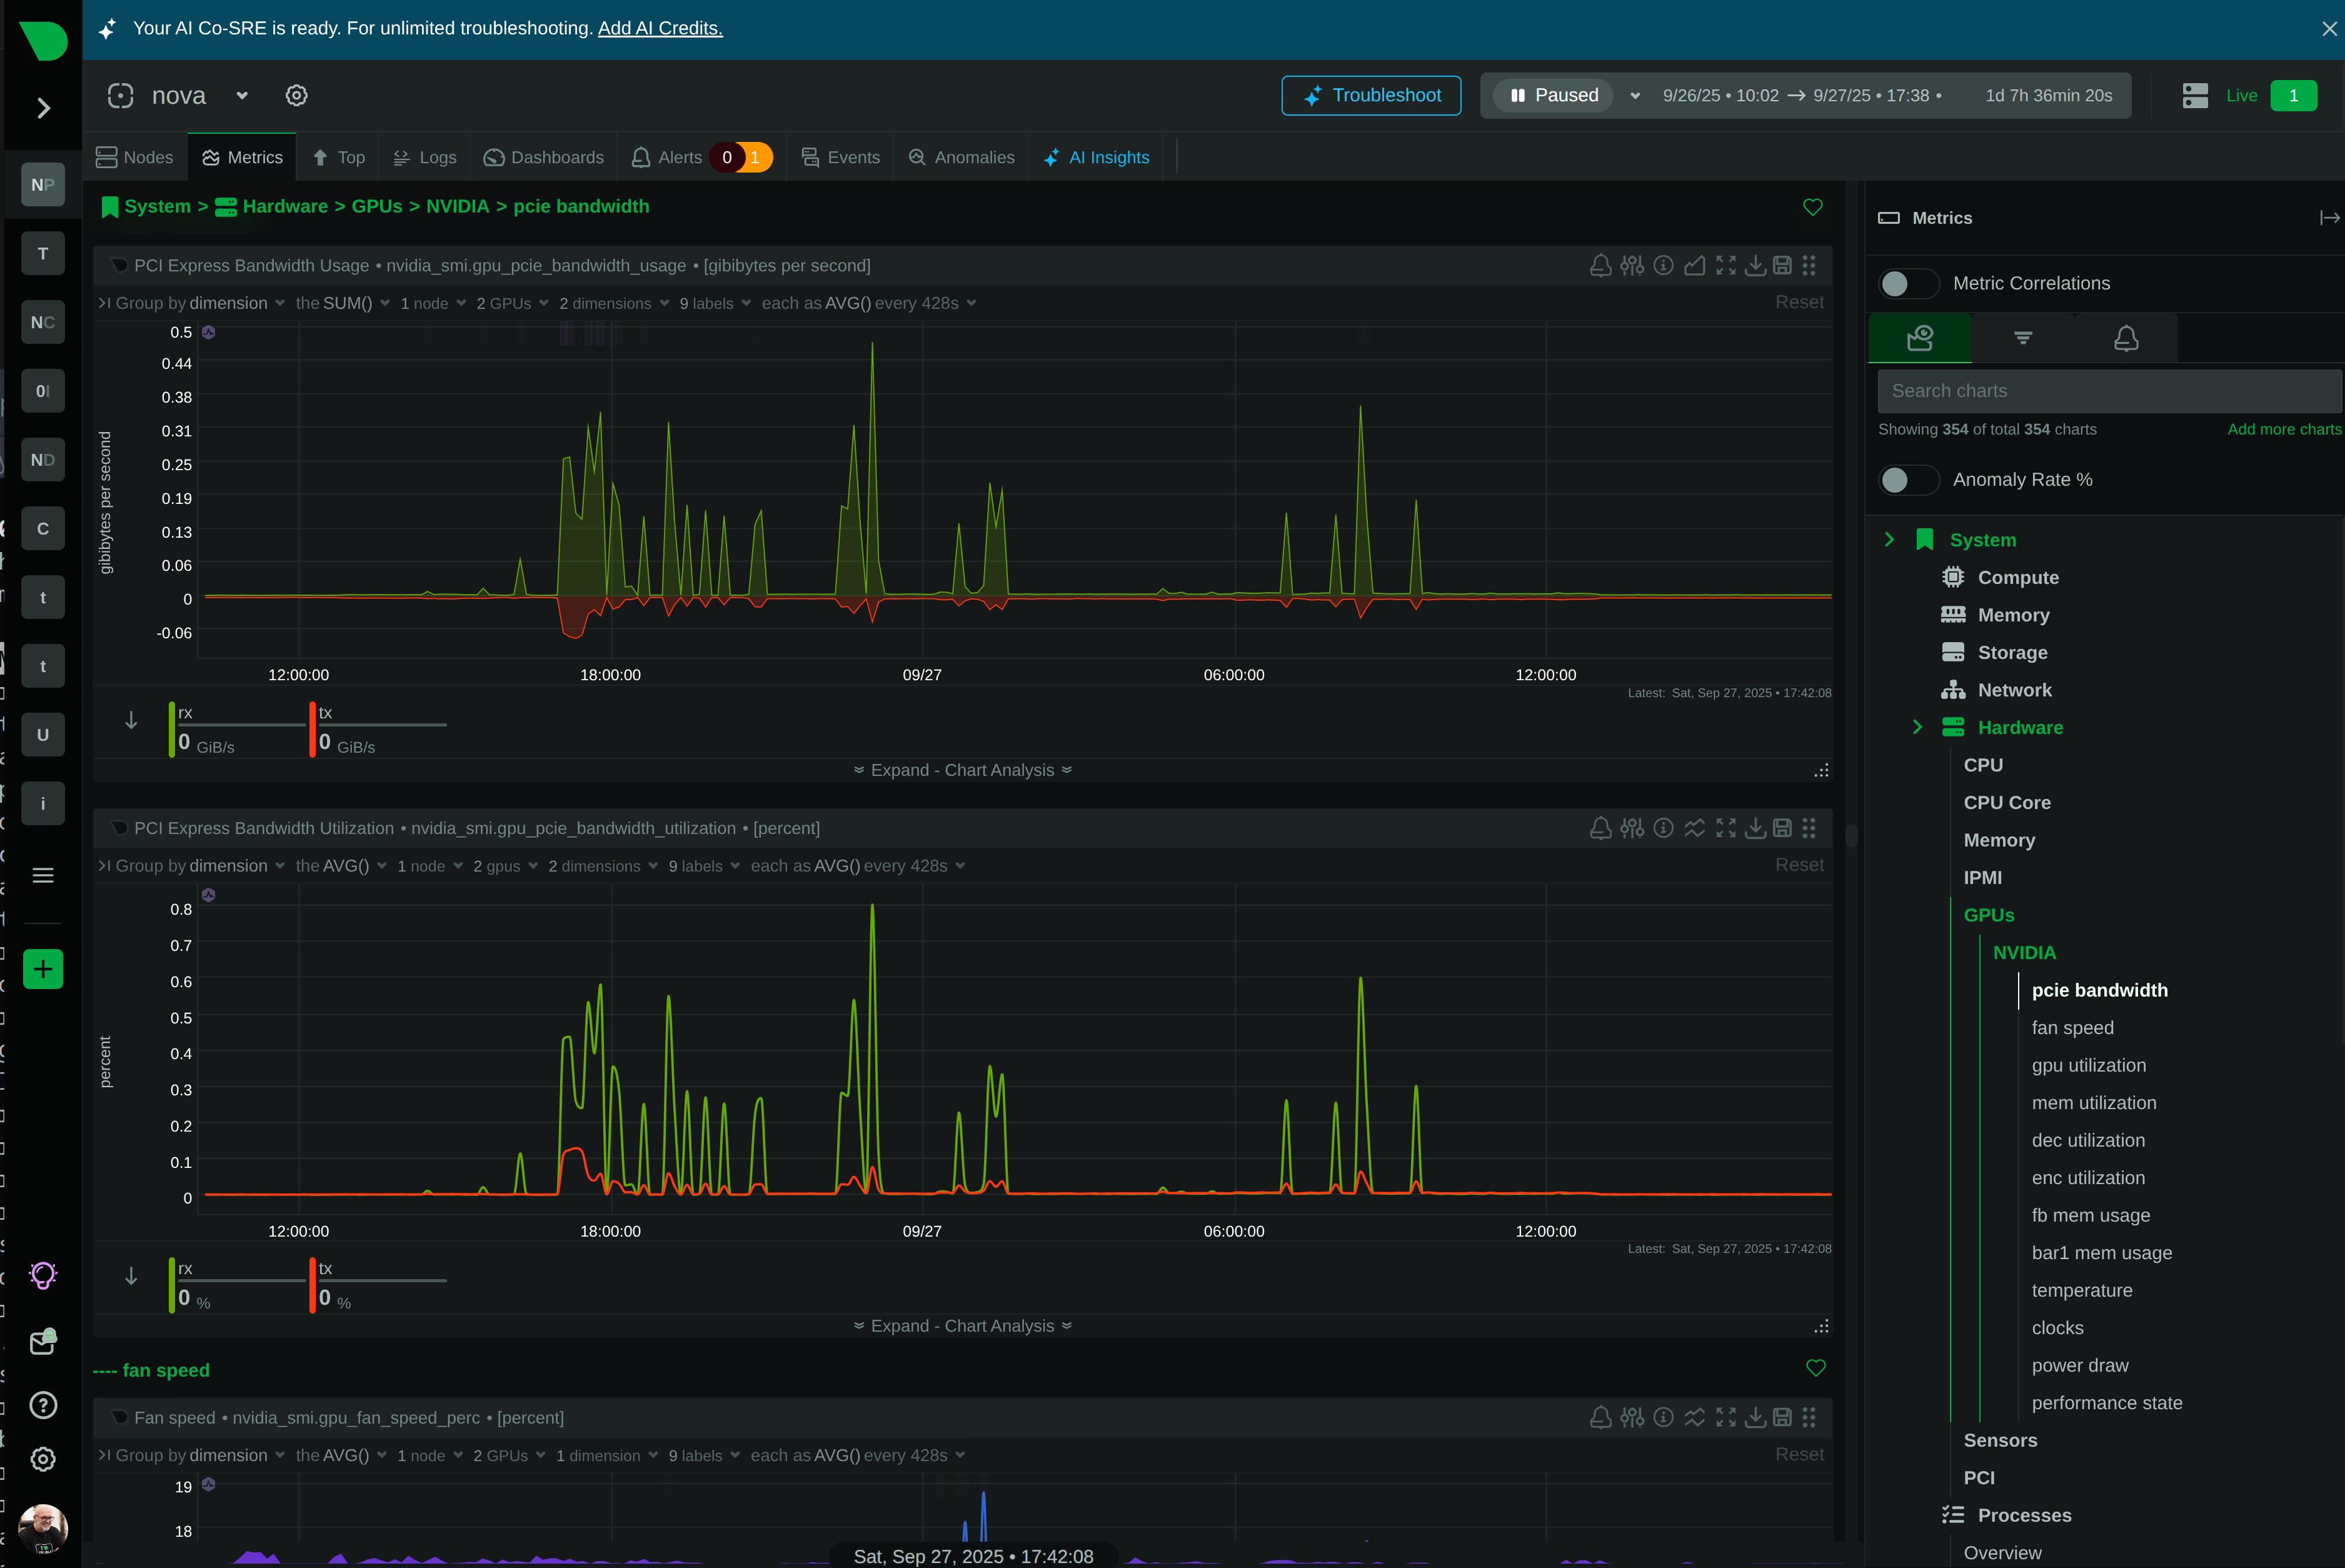
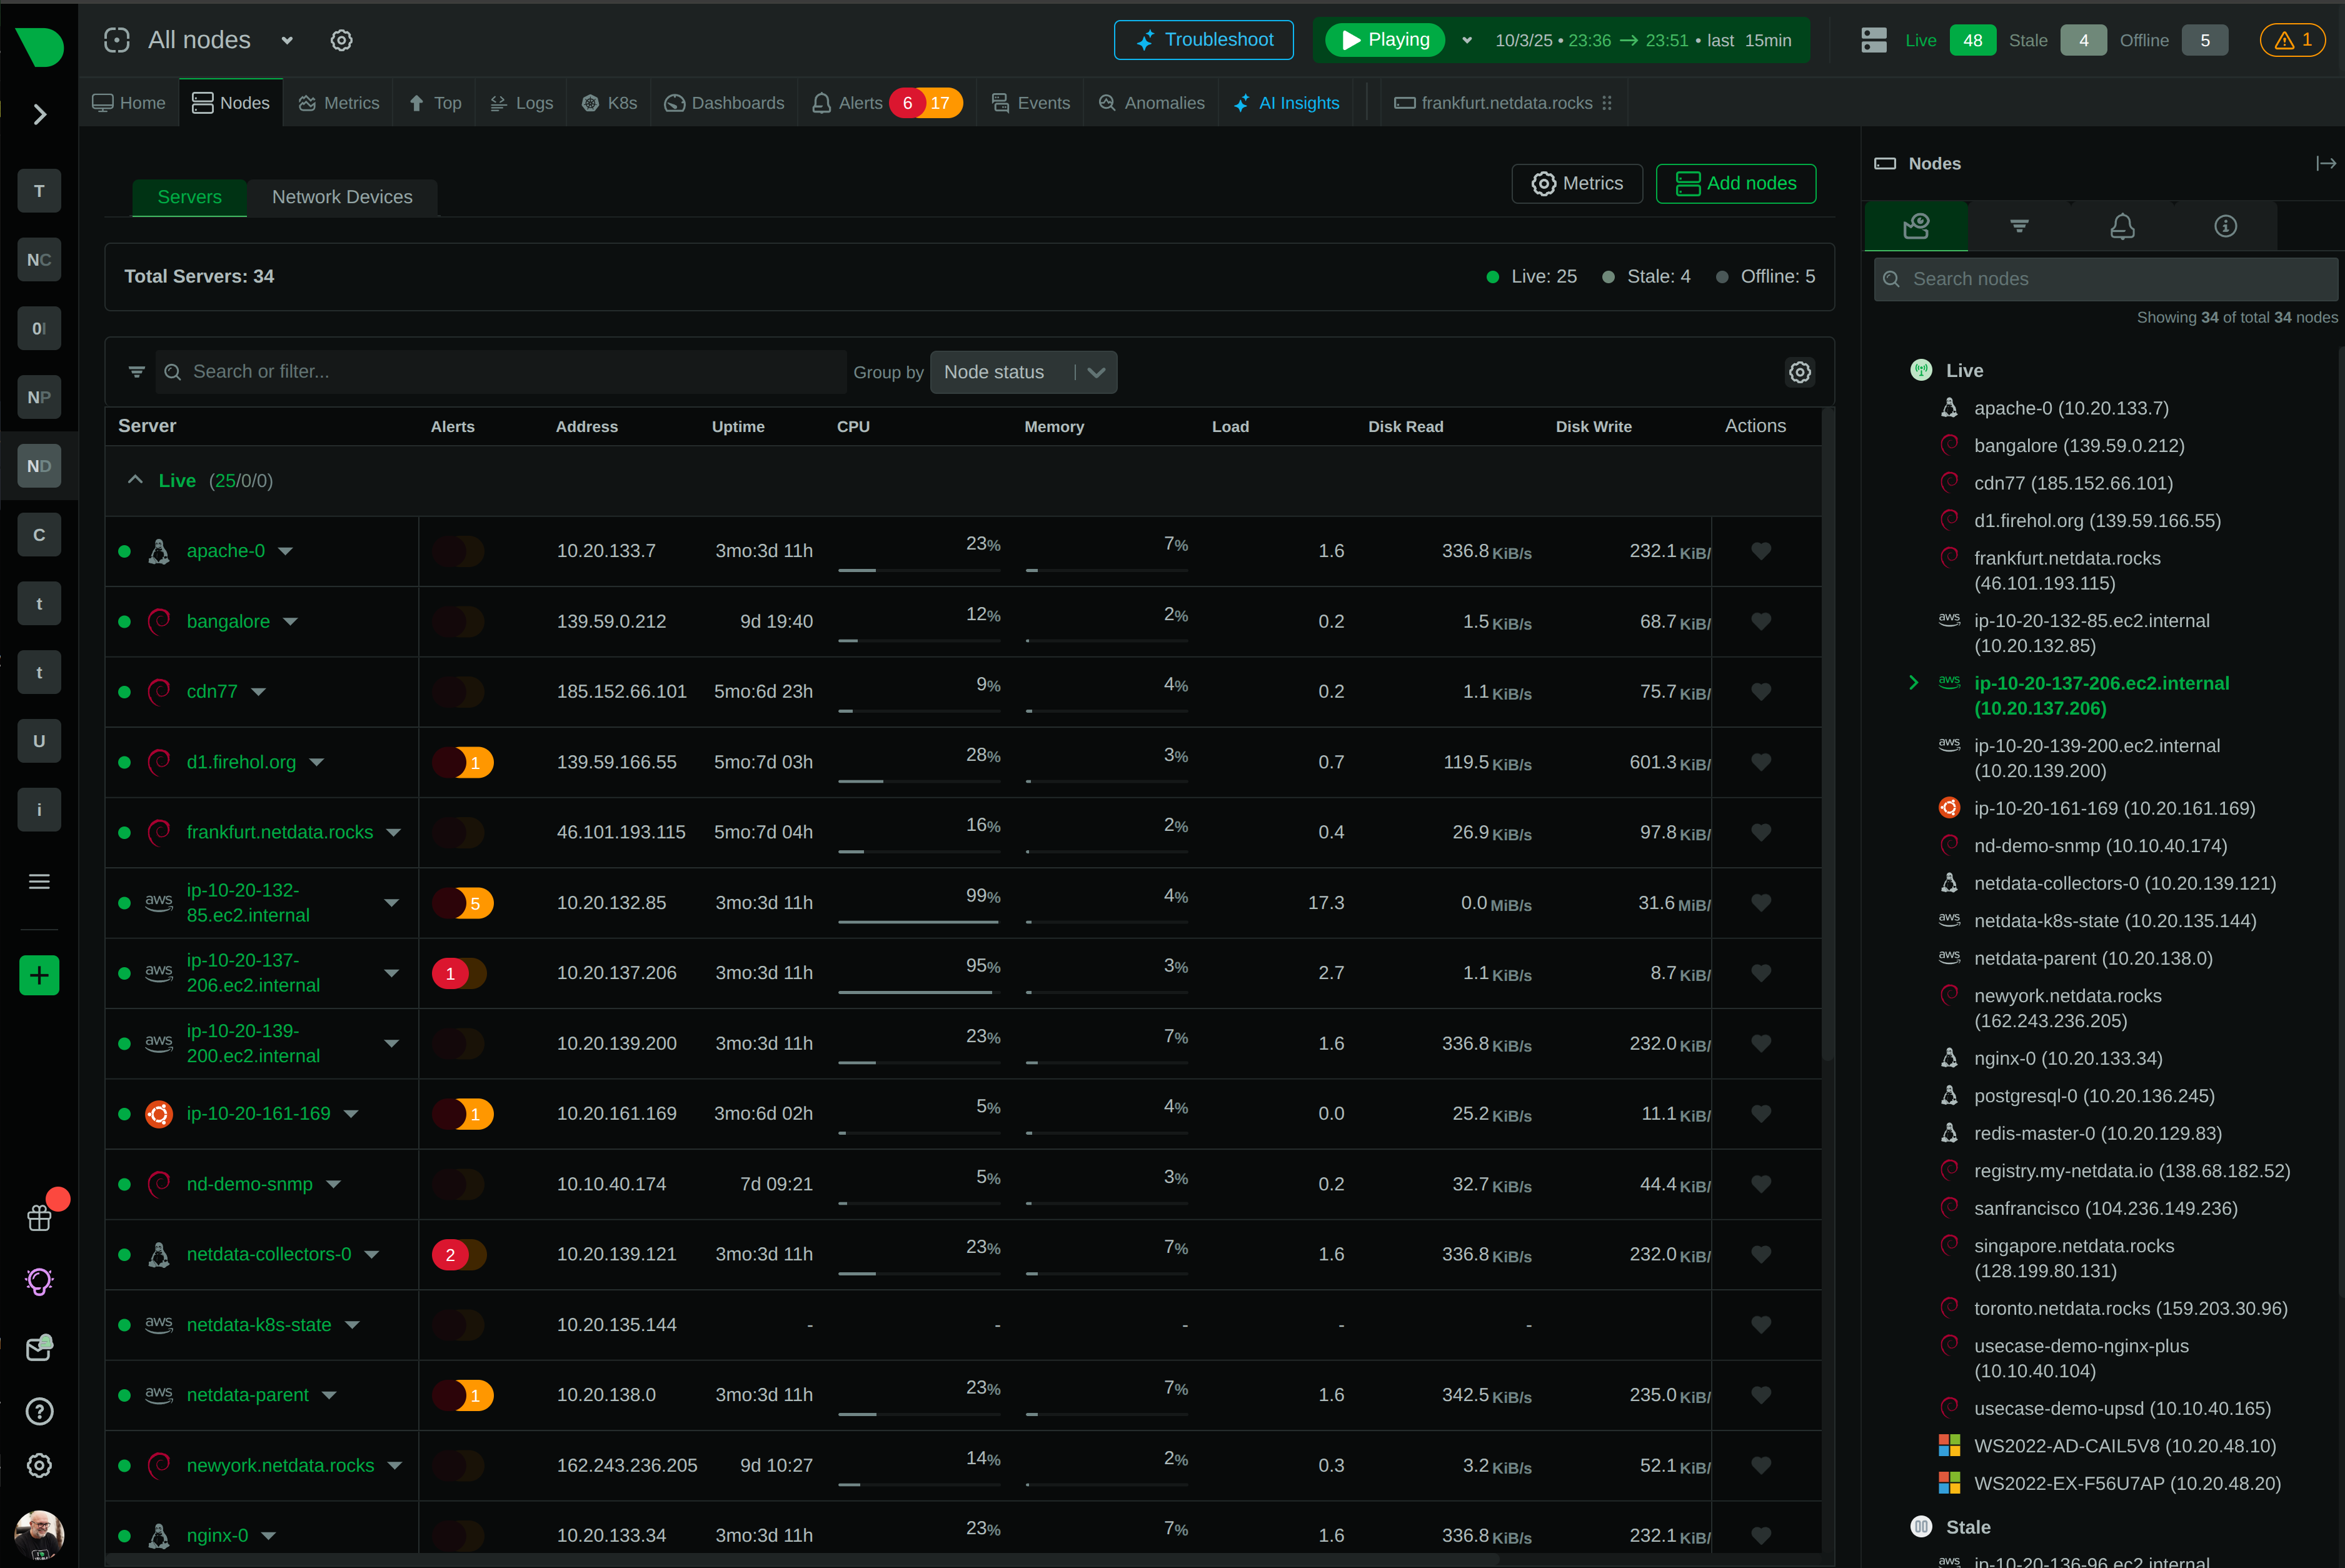
Kubernetes infrastructureMonitor multiple Kubernetes clusters, from testing to production or multiple cloud providers, on a single dashboard. | NodesMonitor hundreds of per-second CPU, memory, disk I/O, networking, and process-level metrics for every worker node. | DeploymentsReduce noise and learn about Kubernetes deployment performance norms by filtering the health map or resource utilization charts. |
ContainersGet one-click access to essential context for faster root cause analysis, such as its node, controller, image name, and pod UID. | ServicesMeasure golden signals from mission-critical services, like queued messages in RabbitMQ, table locks in MySQL, requests per second in NGINX, and much more. | ApplicationsView error rates and response times from instrumented applications (StatsD) for true full-stack monitoring. |
Get started, free
1Sign in for your free Netdata Cloud account | 2On Netdata Cloud, connect each system you want to monitor | 3Monitor and troubleshoot for free with zero configuration |