Apache Monitoring
What Is Apache?
Apache is one of the most widely used web servers in the world. Officially known as the Apache HTTP Server, it was developed and is maintained by an open community under the auspices of the Apache Software Foundation. Since its inception, Apache has grown into an essential component of the web infrastructure. For more details, visit the official Apache website.
Monitoring Apache With Netdata
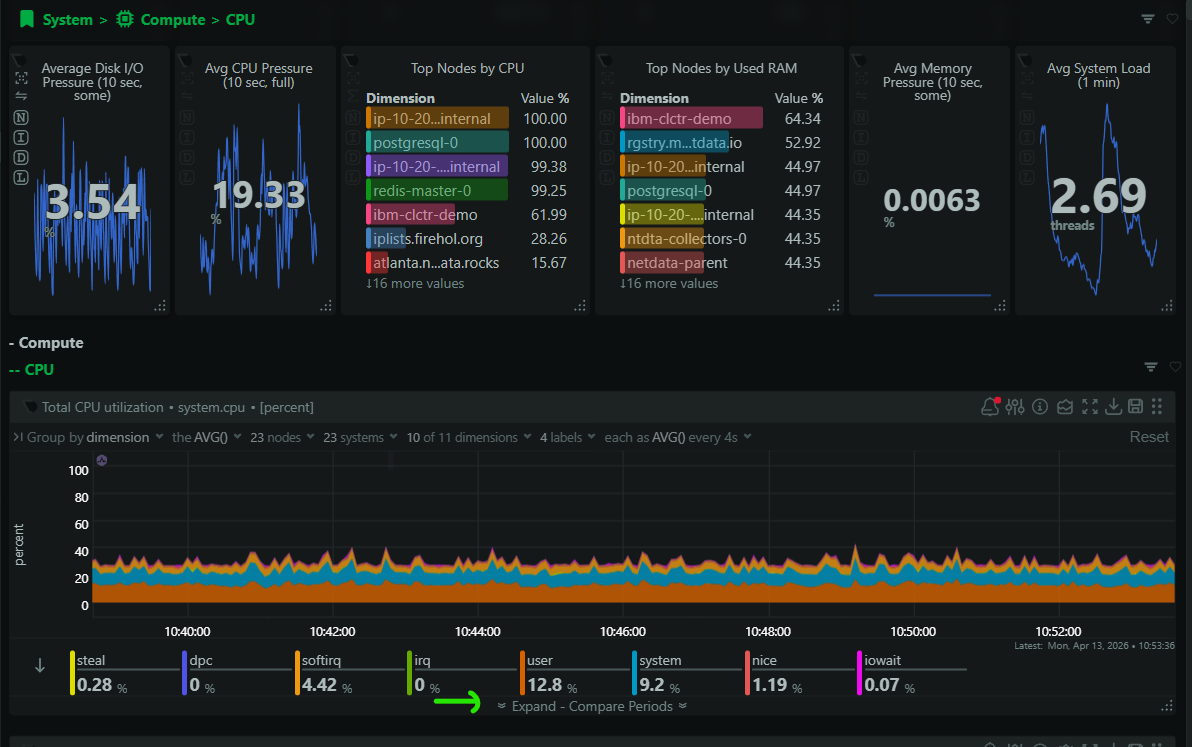
Monitoring Apache is crucial to ensuring optimal web server performance, resource utilization, and improving user experiences. Netdata’s real-time monitoring solution provides instant insights into the performance and status of your Apache server. The Netdata Agent, when deployed, offers a wide array of metrics and visualizations to help you keep track of connections, request rates, bandwidth usage, and more. For a full demonstration, check out our Live Demo.
Why Is Apache Monitoring Important?
Monitoring Apache is important for several reasons:
- Performance Optimization: Monitoring metrics helps identify bottlenecks and fine-tune server performance.
- Resource Management: Proper monitoring ensures efficient use of infrastructure, balancing workloads across resources.
- Troubleshooting & Diagnostics: Gain insight into server behaviors, enabling swift identification and resolution of issues.
- Security: Monitoring helps in spotting unauthorized access and potential threats in real-time.
What Are The Benefits Of Using Apache Monitoring Tools?
Using tools for monitoring Apache offers several advantages:
- Real-Time Data: Immediate visibility into server activities and performance.
- Automated Alerts: Instant notification when metrics exceed predefined thresholds, helping maintain uptime.
- Resource Optimization: Enhanced efficiency through detailed analytics, supporting decision-making for scaling.
- User-Friendly UI: Simple and intuitive visualizations make data accessible and easy to understand.
Understanding Apache Performance Metrics
apache.connections
Counts the total number of connections to the server. This metric is crucial for understanding client-server interaction levels.
apache.requests
Tracks the number of requests per second, offering insights into server load and processing capacity.
apache.workers
Indicates the number of idle and busy worker threads, essential for performance tuning and load balancing.
apache.net
Monitors network traffic and bandwidth usage. Keeping track of sent kilobits per second helps prevent bandwidth bottlenecks.
apache.uptime
Denotes the server’s uptime in seconds, a basic metric useful for system reliability and maintenance planning.
| Metric Name | Description |
|---|---|
| apache.connections | Total number of server connections |
| apache.requests | Requests processed per second |
| apache.workers | Current status of worker threads |
| apache.net | Bandwidth usage in kilobits per second |
| apache.uptime | Total server uptime in seconds |
Advanced Apache Performance Monitoring Techniques
With Netdata, you can go beyond basic monitoring. Use custom dashboards, configure alert thresholds specific to your needs, and integrate additional tools like Grafana for a seamless visualization experience. Advanced monitoring techniques include multi-instance configurations for comprehensive infrastructure oversight.
Diagnose Root Causes Or Performance Issues Using Key Apache Statistics & Metrics
Leverage Netdata to deep-dive into Apache statistics, quickly pinpointing potential root causes of performance issues. By examining metrics like active connections, request rates, and worker utilization, DevOps teams can address performance anomalies efficiently, ensuring web applications run smoothly.
Ready to optimize your Apache server? Sign Up for a Free Trial and start monitoring today!
FAQs
What Is Apache Monitoring?
Apache monitoring involves tracking the performance and health of the Apache web server using various metrics, enabling proactive maintenance and optimizations.
Why Is Apache Monitoring Important?
It ensures your Apache server runs optimally, offering valuable insights into performance issues that can affect uptime and user experience.
What Does An Apache Monitor Do?
An Apache monitor tracks vital metrics like connections, worker status, and request rates, providing data crucial for maintaining server performance and identifying issues.
How Can I Monitor Apache In Real Time?
Netdata offers real-time monitoring with a zero-configuration installation process, providing instant insights and visualizations of Apache metrics. View our Live Demo to see it in action!


