The HTTP protocol has become the de facto standard application layer protocol of the internet. From publicly available web sites and APIs to “inter-process” communications in REST based microservice architectures or large Service Oriented Architectures based on SOAP, you find HTTP being used again and again, due to its simplicity and our familiarity with it. How many protocols can you name that have memes for their status codes? Of course, such a popular protocol has endless pages written about how to properly monitor the services that rely on it, with many options specific to every use case. What you will learn here is how to get your basics done in monitoring HTTP endpoints, so you can be up and running in a few minutes, monitoring all HTTP services in your entire infrastructure.
The basics of HTTP endpoint monitoring
A service should at a minimum:
- Respond (liveness/reachability)
- Correctly (expected status code and content)
- Within a reasonable time (latency)
There can be many reasons why a service might fail in this simple job, but we’re not going into that. It should be really simple for a system to constantly perform these basic checks and notify us if anything fails. With Netdata, it is.
The Netdata HTTP endpoint monitoring collector
You can get a Netdata account on https://app.netdata.cloud and have Netdata installed on any node in minutes. Then just go to the Netdata configuration directory (usually /etc/netdata) and run ./edit-config go.d/httpcheck.conf. After entering the endpoint, you restart netdata and see the charts within seconds.
Here’s a sample configuration to monitor a web page, an HTTP endpoint accept POST requests and a SOAP service running over HTTP:
jobs:

  - name: Netdata App
    url: https://app.netdata.cloud
    status_accepted: [200, 204]
    timeout: 2

  - name: POST test
    url: https://httpbin.org/post
    method: POST
    body: 'key1=value1&key2=value2'
    response_match: (?ms).*key1.*value1.*key2.*value2.*

  - name: SOAP test
    method: POST
    url: https://www.dataaccess.com/webservicesserver/NumberConversion.wso
    headers:
      Content-Type: 'text/xml; charset=utf-8'
    body: |
      <?xml version="1.0" encoding="utf-8"?>
       <soap:Envelope xmlns:soap="https://schemas.xmlsoap.org/soap/envelope/">
        <soap:Body>
         <NumberToWords xmlns="https://www.dataaccess.com/webservicesserver/">
          <ubiNum>500</ubiNum>
         </NumberToWords>
        </soap:Body>
      </soap:Envelope>
    response_match: invalid response for testing
The collector supports a lot of options for HTTP including authenticated proxies, TLS options, specifying the acceptable HTTP response codes and more. What we request with this configuration is a very simple test against a web page, a test where we POST a specific payload and expect a response that includes the parameters we passed and a test of a SOAP service that we deliberately rigged to fail the response content check. Note how for the SOAP service we had to provide the Content-Type in the headers.
We can see what this configuration gets us in the Netdata Demo Space:
Does each service respond… correctly?

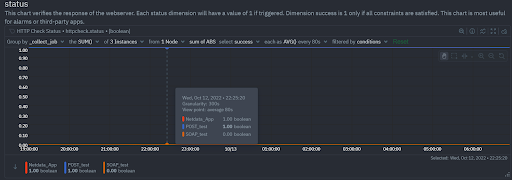
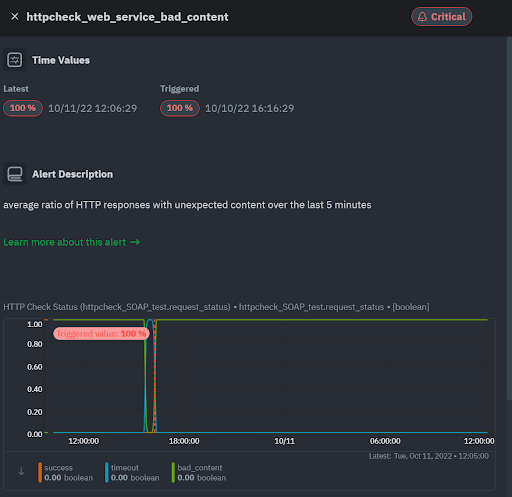
This is the default status chart in the overview screen of https://app.netdata.cloud for the 3 jobs specified. We see that only two of the services respond successfully. As expected the SOAP test consistently fails, because we rigged it with an invalid check on the response content. We can verify with this chart that indeed the failure is due to bad_content, by selecting to display the bad_content status, instead of success:

You can play with these options on the charts as much as you want and save each view in a custom dashboard if you want. However, all that is not really necessary, because we have also received a predefined alert for this bad content:

We’ll see the list of predefined alerts for HTTP endpoints later but rest assured that the common checks are performed automatically, and you will be notified of important issues.
Does each service respond… within an acceptable time?

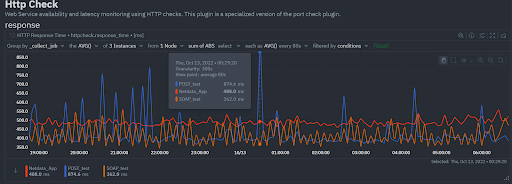
The response chart on the Overview screen of https://app.netdata.cloud shows each job name along with each request/response latency. We can see in the time series of the POST web service that it occasionally has high latencies. We are working to have all latency charts in Netdata presented by default with heatmaps, but this representation along with the out of the box alerts is sufficient for most use cases.
Alerts
Netdata comes out of the box with the following alerts, which you can edit via ./edit-config health.d/httpcheck.conf:
- A fast-reacting no-notification alarm ideal for custom dashboards or badges, which checks if the average ratio of successful HTTP requests over the last minute is lower than 75%.
- The bad content alert we saw above is triggered if the average ratio of HTTP responses with unexpected content over the last 5 minutes exceeds 10% for warning, or 40% for critical.
- The default latency alert checks the average HTTP response time over the last 3 minutes, compared to the average over the last hour. If the recent latency is twice as slow as the usual latency we get a warning and if it’s three times as slow or worse, we get a critical alert.
- Finally, there’s a combined timeout & no connection alarm to verify reachability. It looks at the ratio of failed requests either due to timeouts or no connection over the last 5 minutes
Conclusion
With Netdata, you can quickly and easily ensure that your HTTP API endpoints or web site respond correctly, within acceptable response times. The Netdata agent is Free Open Source Software (FOSS) and the cloud is also free forever, so there’s no reason not to give it a try today!


