


Infrastructure monitoring was difficult enough when entire businesses ran off a few bare metal servers in a dusty, forgotten closet. Other IT infrastructure monitoring tools fell short, unable to provide complete and granular-enough metrics in real time, even when we were only dealing with a handful of systems responsible for running every part of the application stack. They were hard to configure, especially for the non-gurus out there, and didn’t provide the high-resolution metrics the gurus needed to make data-driven troubleshooting decisions.
Unfortunately, we’re way past those “simple” times of yesterday’s infrastructure. According to the Stack Overflow Developer Survey 2020, Kubernetes is the third-most loved platform (71.1%) among developers who tried it, and the third-most wanted (18.5%) platform among those who haven’t. This might sound like old news, but the truth is that the Kubernetes architecture revolution is just getting started. As the tooling around building complex Kubernetes deployments gets even more effortless, regardless of which cloud platform you choose, it’ll become one tool of choice for developers who want to make their lives easier.
Today, we’re starting on our mission to solve all those problems for the developers who want a powerful Kubernetes monitoring tool right now and the SREs or sysadmins who know exactly what they’re looking for. Before we jump into exactly what we’ve built, and talk about why we’re so excited, let’s explore Kubernetes monitoring from a thousand-foot view.
What is Kubernetes?
Kubernetes (k8s) is an open-source container orchestration tool for automating how DevOps teams deploy, scale, and manage their infrastructure. Basically, it takes a lot of the headache out of putting complex web applications into the wild for users to interact with. Kubernetes deploys a full-stack application using containers (often Docker, but not always… more on that in a bit), which provides each part of said app with its own lightweight filesystem, CPU share, memory, and more.Containers don’t rely on any particular hardware or cloud provider configuration, which means they’re portable. Kubernetes runs in homelabs, on-premises, in a managed cloud provider (such as Amazon Elastic Kubernetes Service (EKS) or Google Kubernetes Engine (GKE)), and just about everywhere in between.
Why are DevOps teams using Kubernetes?
Running Kubernetes in production is like having an industrial robot for deploying, scheduling, updating, and scaling an infrastructure across multiple hosts. Kubernetes doesn’t care where you run your application in the world, or on what hardware. This portability helps DevOps teams in a lot of time-saving ways:- Replaces a lot of manual processes, such as provisioning/configuring new servers/virtual machines (VMs)
- Configurable with version-controlled files, enabling both Infrastructure as Code (IaC) and GitOps practices
- Simplifies migrating from one environment to another due to container portability
- Self-heals failed containers by killing, replacing, or recreating them without intervention
Kubernetes vs. Docker: What’s the difference?
Kubernetes creates, manages, and maintains Linux containers using a “Container Runtime.” Docker (Dockershim) is the most popular runtime for Kubernetes clusters, which is why the two are often confused, but you can run one without the other.However, Docker won’t work in Kubernetes forever. In December 2020, the Kubernetes project announced it would deprecate Dockershim, which means organizations running Docker containers in their cluster will need to reconfigure worker nodes to use either the Container Runtime Interface (CRI-O) or containerd runtimes instead. Soon there will be less confusion about Docker vs. Kubernetes, but Docker will still be incredibly useful for developers who want to standardize their development environments and make them portable across systems—no more “it works on my system” arguments.
What makes Kubernetes monitoring hard?
With traditional infrastructure monitoring, DevOps teams monitor applications that run on physical servers, which have strict resource utilization limits. In this mode, a simple infrastructure might be a single database instance, a single web server, and a user-facing web application, all running on one piece of hardware. On occasion, these traditional infrastructures add virtualization into the mix, which lets DevOps run multiple isolated workloads on the same piece of physical hardware.Infrastructure monitoring is hard enough even with these “simple” deployments. To understand the true performance and availability of an application, you need to prod at every layer of the stack, make sure you’re collecting the most relevant metrics at the proper granularity (how often metrics are collected/stored), and then you need some visualizations to make sense of everything you’re looking at.
Netdata makes infrastructure monitoring a lot easier, especially in real time, but Kubernetes takes the traditional problems and amplifies them. Kubernetes adds more moving parts to your infrastructure, such as the agents and control planes responsible for managing containers.
Instead of one database, one web server, and one app, you might have 20 abstracted and ephemeral containers, which appear and disappear seemingly at random and leave no trace of their existence. These containers are constantly querying and sending data amongst themselves, and it’s now your job to eavesdrop on the conversation and figure out the performance and availability truth. There’s a lot of overlapping concerns, all of which often have no easy answer:
- It’s hard to know what you’re supposed to look for. If you don’t know that you’re supposed to keep tabs on kube-proxy or coredns, how would you know to create charts for them and add them to your Kubernetes monitoring dashboards?
- It’s hard to see what’s inside of containers. You can’t SSH into them and find the root cause of an issue, especially if it’s an ephemeral container that’s disappeared, so you’re forced to create new troubleshooting strategies that don’t rely on history.
- It’s hard to monitor multiple clusters in one place. If your metrics collection and dashboarding software operate within the cluster itself, there’s no way for you to compare the performance of a staging cluster directly against that of a production cluster.
- It’s bound to be expensive, either in time or upfront cost. If you’re hoping to avoid a big monthly bill, there’s lots of open-source Kubernetes monitoring tools to choose from, but most require a complex sequence of collectors, databases, and visualization tools that you have to manage yourself. There are big-ticket enterprise solutions, too, but they have other limitations, like the one below.
- It’s too simplistic. Most Kubernetes monitoring software hides information and provides you with pretty diagrams of your infrastructure, then assumes you’ll run kubectl logs … every time you run into an issue. They solve the abstraction in Kubernetes with abstraction of their own, leaving you with very little real information.
How does Netdata help you monitor Kubernetes?
Netdata now offers Kubernetes monitoring that solves all the above problems—including cost—while being both simple and powerful.As a monitoring solution, Netdata relies on the open-source Agent to collect and store metrics data from any number of distributed systems. In a Kubernetes cluster, that’s any number of nodes, each of which runs the Kubernetes agents responsible for creating and managing pods/containers. Netdata then streams all those metrics to Netdata Cloud for monitoring entire Kubernetes clusters with none of the traditional implementation headaches or setup complexity. Because of this distributed, streaming data architecture, Netdata can scale to meet the needs of any size of deployment.
When you deploy the Netdata Agent on your Kubernetes cluster with our Helm chart, it automatically spins up the appropriate number of pods and collects metrics from the node itself, kubelet/kube-proxy, and any containerized services/applications, such as databases and web servers. Everything is autodiscovered, magically configured, and available for you to visualize in just a few minutes.
Our point-and-click approach to Kubernetes monitoring and troubleshooting
Netdata’s Kubernetes dashboard comes with powerful, meaningful visualizations out of the box. Here are some of our favorite new features:A cluster health map, which shows you resource utilization for every part of a Kubernetes cluster. The health map visualizes each container/pod as a single box, then varies the intensity of its color to help you instantly identify problem areas.
Visual resource utilization indicators, which help you pinpoint issues by selecting different metrics and aggregation functions. In a few clicks, see insightful cross-sections like the maximum memory usage per container, or the average writeback memory usage per pod.
Custom displays and filters that exclude noise and expedite troubleshooting, such as displaying only pods, only containers, and grouping everything by helpful Kubernetes labels, like the controller kind of Kubernetes node. Add filters on container IDs or namespaces to focus on specific pods/containers during troubleshooting.
Instant insights with real-time metrics. Hover over any box in the health map to see essential contextual information and real-time resource utilization metrics from that resource. Once you’ve found the problematic pod/container, with metrics streaming in real-time, you can save yourself headaches by bringing out kubectl only when you know exactly what you need to resolve an issue.
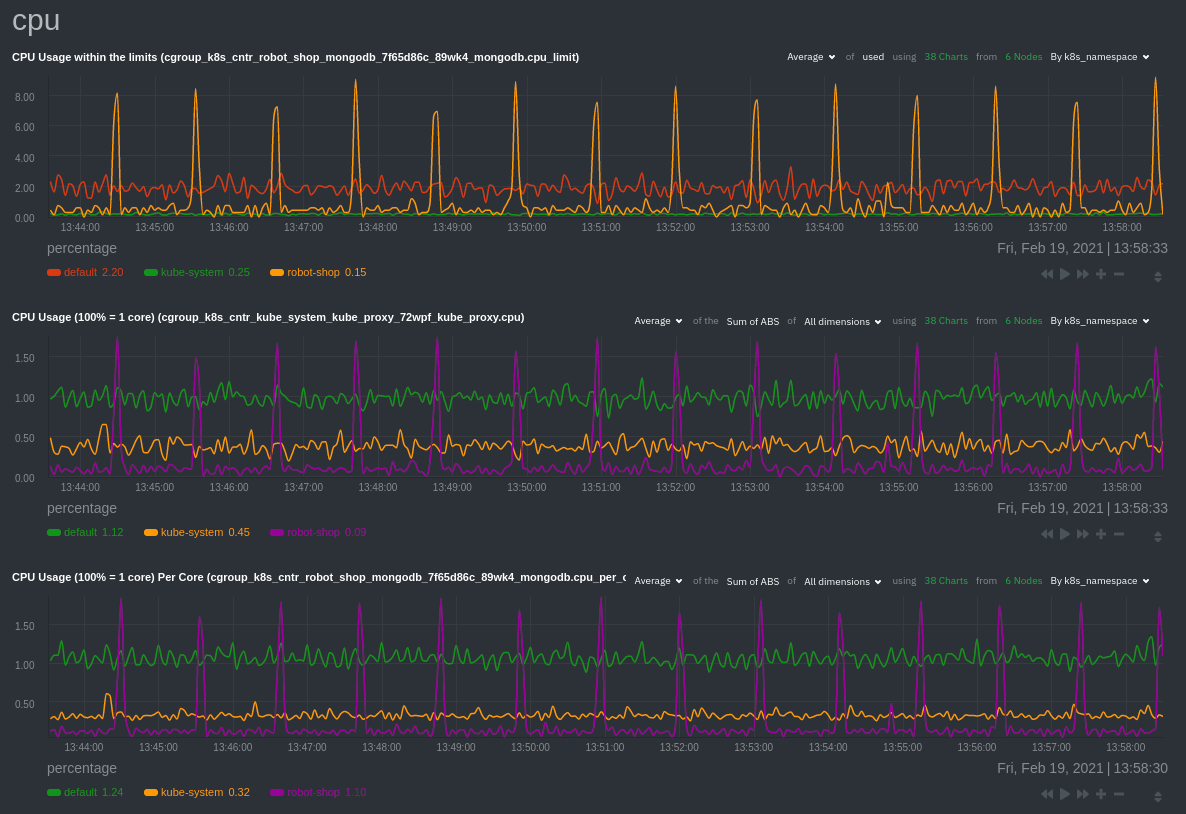
Impact analysis with time series correlations, powered by Netdata’s composite charts, which aggregate metrics from any number of distributed nodes. See resource utilization over time, across nodes, pods, or containers, and troubleshoot with familiar netdata patterns.
Simple ≠ simplistic
With Netdata, Kubernetes monitoring is simple, but not simplistic.That’s an important distinction. We made Kubernetes monitoring easier, but the engine that drives the health map and time series composite charts is enormously sophisticated.
We took this approach because we felt like no other DevOps monitoring tools focused on the developers who are building next-generation infrastructure right now. The same Stack Overflow survey mentioned above also showed that 40% of developers have less than 5 years of experience.
These developers love Kubernetes and want to deploy applications in it, but they haven’t had enough time to understand their stack, Kubernetes’ inner workings, and monitoring best practices. Or maybe there’s some other blocker, like a siloed Ops team that holds onto the keys to the dashboarding kingdom, or an intense demand to deliver without time to get educated on Kubernetes monitoring. Maybe they just need a new, simple way to bring monitoring tools into DevOps processes to break down silos and make better decisions about building, deploying, and maintaining their application.
These are the people we’re trying to help, while also providing every per-second metric for the power users who are ready to drill down, troubleshoot, and resolve issues right now.
Get started with Netdata’s Kubernetes monitoring for free
These new Kubernetes monitoring features are available today for every Netdata user. If you don’t already have an account, get started for free.To get started with monitoring Kubernetes, see our deployment doc. Deploying the Netdata Agent across your cluster takes about one minute! See the embedded video below for a real-time demonstration.
Next, check out the reference docs for details on using the health map and time series charts.
Happy (Kubernetes) monitoring!