


There is a lot of buzz in the world of machine learning (ML) and as a layperson it can be hard to keep up with it all. Therefore, we decided to write down some of our thoughts and musings on how we are approaching ML at Netdata.
Our Approach to Machine Learning (ML)
We’ll touch on the current state of applied ML in industry in general, and zoom in on ML in the monitoring industry. We’ll discuss how we can leverage “good honest ML” to punch above our weight and add some useful and novel features for our users over the next few years.
No nonsense, ever
This is first for a reason. Too many companies in too many industries try to mystify and oversell ML-based features. These narratives are used to generate hype but they put up artificial barriers to a wider understanding how ML actually works. Ideally, we would like to end up in a world where ML is just another tool in the shed. Therefore, we will actually explain in detail how our ML works under the hood. Knowledge is the best way to empower our community to understand the cases where various ML-based features might not be so reliable and cases where they can be very useful.
Whenever I see competitors or new startups in the observability and monitoring space putting “AIOps” as a central selling point, I get curious and try to dig deeper. I visit their docs and actually try to understand: (1) How are they actually formulating the problem to make it amenable to ML? (2) What ML techniques are they actually using?
9 times out of 10 I am left none the wiser, even though I have been an ML practitioner of many years.
In contrast, if you want to learn a little about how our unsupervised anomaly detection works, you can just check out the README.md right next to the code. The first few paragraphs straight off the bat tell you the algorithm is based on good old kmeans clustering. In the notes there are further presentations (feel free to add a comment) and even a python-based colab notebook to go into more detail if you are so inclined.
Companies should rejoice and take pride in openly explaining how their ML works. Laying out the various pros and cons of their approach helps users be more informed when they use these features.
Observability is actually behind when it comes to ML
When you compare the observability industry to other industries like advertising, finance, or technology in general, observability is actually quite far behind when it comes to leveraging ML as a core building block. A lot of what people call “AIOps” is actually just “fancy plumbing” (auto discovery, open standards for integrations, good solid data engineering etc). Fancy plumbing is very important and impressive in its own right (it’s a core part of what Netdata Cloud does) but it is not ML.
There are some exceptions to the rule here. More and more companies in the space are building out ML-driven capabilities but it’s still considered special or novel to leverage ML in the observability space. Whereas in industries like advertising or finance, concepts like click-through rate prediction or churn prediction are core to what those businesses actually do.
Monitoring agents don’t need to be dumb
It seems like a big missed opportunity that we have all these monitoring agents that just blindly collect data and pass it on. What a waste. Sure this makes sense if all that data lands in some centralized cloud store. There, you can take the “kitchen sink” approach and throw all popular ML algorithms at the problem, so long as you can eat the cloud costs or pass them on.
What if, instead, the agent could actually not just blindly pass on the data but also learn a little from it as it sees the data? These insights might be useful when things go wrong. Or, even more ambitious, what if that agent could actually “do some ML” when you need it to help you solve a problem?
We can think of two main ways to implement this “always-on ML” vs “push-button ML”.
- always-on ML - ML that runs continually on the agent as data flows through it. An obvious example here is running anomaly detection on the agent itself, implemented as cheap and efficiently as possible.
- push-button ML - This scenario works best when you have a specific use case where you would like to “ask” the agent for some answer about your data. The agent would then run the relevant ML algorithms to get that answer. For example, at Netdata, we are currently implementing a push-button ML approach to move our Metric Correlations from a cloud-based service to a new endpoint on the agent itself. Another example might be clustering all your metrics on demand so that you can see which metrics “naturally” “group together” in some sense.
There are obvious limitations to how much work you can push onto a monitoring agent before you risk the agent itself taking too many resources from the system it is supposed to be monitoring. Many ML-based features on the agent will initially be opt-in, allowing you to enable these more advanced capabilities as your node allows. To provide even more flexibility, you could set up streaming, so that the ML-processing happens on parent agents only. Ultimately, we want to give you as many options as possible to avoid huge cloud-based centralization costs that other tools often assume in their approach.
Beyond raw metrics
Metrics are one of the pillars of observability and as such, a lot of people and companies focus on them. But what a raw metric represents often requires a lot of manual context to come from somewhere (What container was it running in? What application does it actually relate to? And so on…). For example, at Netdata we group metrics into semantic contexts and families which is how they are then visualized on charts and in menus.
What if we go beyond the raw metric alone as a core building block and introduce some notion of “strangeness” along with the raw value itself? When done right, this can provide one form of, potentially useful, context right out of the box. Based on past observations, does this raw metric look somewhat expected or unexpected?
Our first attempt at this is called the “Anomaly Bit”, which is basically a 0 if the recent raw metrics look normal enough or a 1 if they look sufficiently different from the model’s definition of “normal”.
We’ve recently added the capability for the Netdata agent to produce an “anomaly bit” in addition to each raw metric value every second, with no extra storage overhead and typically negligible CPU cost. For example, have a look at some recent raw CPU metrics from one of our demo servers, and their corresponding anomaly bits (they are probably mostly 0 assuming all is normal on the demo server, but you may see some 100’s). When you start aggregating anomaly bits beyond 1 second (to 5, 10 second etc), you will get an “anomaly rate” for every metric out of the box. Here are the corresponding anomaly rates for each CPU dimension above (note that in the URL we have added points=1 to just average all the underlying anomaly bit’s into a single one number anomaly rate for each metric).
The big idea here is that you can look at your raw metrics as usual, and see the corresponding anomaly rates alongside them. That additional context helps you decide if you are looking at normal and expected metrics or if something is maybe a bit strange that might merit further investigation.
Innovate but resist the urge to be too fancy too soon
Building on the idea that observability is actually still quite early on in its ML journey, there is often little need to get too excited, fancy or complex with what ML-based features you explore first.
“Good honest ML” is the term we use internally in this regard. You can go a long way with relatively simple, well understood algorithms and approaches before you need to get complex and implement the latest hyped deep learning model (which we do of course want to get to, but only when its time and we have built a useful v1 of the solution first).
Starting with the simplest, but still useful, approach will help you get to the, often harder, UX challenges and struggles. This means that you end up with a simple, understandable baseline on which to build initial features. If you can’t make a useful enough MVP feature based on fairly simple ML approaches, that’s a sign that there may be something more fundamentally wrong with how you are approaching the problem.
Once you get traction and prove the approach has merit, you can then get as fancy as you want later in terms of the ML running “under the hood”.
Human in the loop
Why would we pretend that the ML actually “understands” the data? It doesn’t. At least not without a lot of effort encoding the semantic meaning of the data which at best is still very much an open research area. Anyone promising you that it does “understand” is usually selling you snake oil or at best maybe does not really understand how it works themselves.
Instead, it seems more obvious to focus on the UX of it all. After all, especially in a monitoring system, it’s going to be the human that will decide if the ML insights point to an anomaly, or if no action is required. If the ML shows you something useful even 1 in 10 times that should be considered amazing. The challenge lies in the implementation of the UX for the other 9 times the ML was wrong or not so useful. In this regard we should aspire to make the experience as easy and painless as possible.
Lego blocks
We want ML to be just another “part of the furniture” of Netdata. As such, our aim will be on small, discrete ML features or functionality that can play well with other parts of Netdata. The end goal is to empower users with a whole toolbox of different ML features that they might bring to bear when troubleshooting, and feel confident and educated on when to maybe try one over the other and usefully interpret the results.
For example, we are working on making the “anomaly bit” available to the health engine. A user could easily derive an alert based on the anomaly rate of a metric (or group of metrics) in addition to just triggering based on traditional hard coded rules evaluated against the raw metric values.
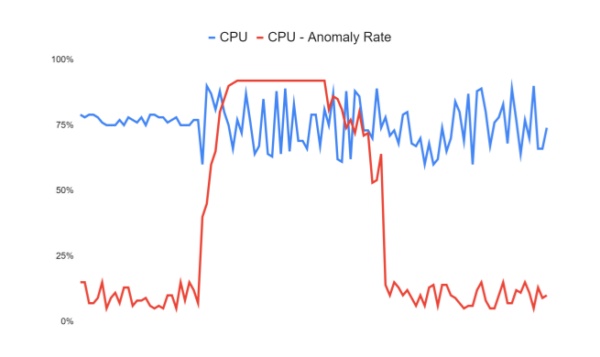
In the stylized example below, let’s say you always run your CPU usage steadily around 75%. You could manually configure and alert once it goes outside some upper and lower threshold. But often data turns anomalous in ways you could not have foreseen - so the idea is that you could just set an alert based on the anomaly rate. If the anomaly rate corresponding to the CPU metric (the orange line) passes say 50% and stays elevated for long enough, you would be alerted. So we still have thresholds, but the thresholds are set against the anomaly rate which can capture more naturally all the ways your data might turn anomalous instead of you having to think of a rule for every scenario. It may even be that the new behaviour represents some new normal following a code change you made, in which case you may want to see the impact of the change but also have the ML retrain to learn the new pattern for what’s considered normal, all without having to change any alert rules. This is the essence of ML: Instead of having to think about all the logic and decisions in advance, you pass some of that complexity off to the ML model itself, and you then are just a consumer of its outputs.
Another goal will be to expose the anomaly rates corresponding to all alerts to help give some quick additional context when viewing or trying to prioritize alerts. Traditional visual anomaly detection has always been a core part of what Netdata does, in built anomaly rates should only aid in this visual flow.
There is no one size fits all model or solution - we just want to give our users a few extra tools in their toolboxes. Over time, they will become experts in leveraging our ML-based features and we will hopefully make their lives a little easier when using Netdata for monitoring and troubleshooting.
Embrace uncertainty
We can never be 100% sure “if the ML will work” when thinking about new potential ML features. Often, we simply don’t have the data we would need to try and even begin to scratch the surface in answering this question. Nevertheless, it should not bog us down and get in the way of innovation. Even if we validate as best as we can that it works on our own production data, while very useful and encouraging, that’s still a sample of size 1.
Too many times when it comes to new ML projects, new ideas turn into 6 month research projects that struggle to get anywhere. Instead, we want to focus on (almost embarrassing) initial POC and MVP based features. We can introduce and explore them in a safe and de-risked way. Then we can focus on telemetry and user feedback to figure out if or how well they work and identify areas for further improvement.
Minimize learning curve
We’ve discussed how ML is often overly mystified and under-used in the monitoring and observability sector. To counter these obstacles, our mission is to make the adoption of ML features as easy and understandable as possible to our users. Apart from good usability, there should be layers of reference material so that users who just want to get a quick overview and start using features can get up and running. Those more curious can go as deep as they like, and ideally even learn a little about machine learning in general along the way. We are stronger together, so the more our features are used, the more we can improve them and lighten the burden of troubleshooting for the Netdata community.
If you’re interested in ML and observability come join us in the 🤖-ml-powered-monitoring channel of the Netdata discord or feel free to create a GitHub discussion if you’d like to learn more.