X-Ray Vision for Your >Infrastructure<
Every metric, Every second. No BS. No delays. No blind spots. No excuses. Just the fastest, rawest, most powerful monitoring—on autopilot.
Every metric, Every second. No BS. No delays. No blind spots. No excuses. Just the fastest, rawest, most powerful monitoring—on autopilot.


Troubleshoot faster, slash downtime and keep your infrastructure running reliably with real-time visibility and AI powered insights.
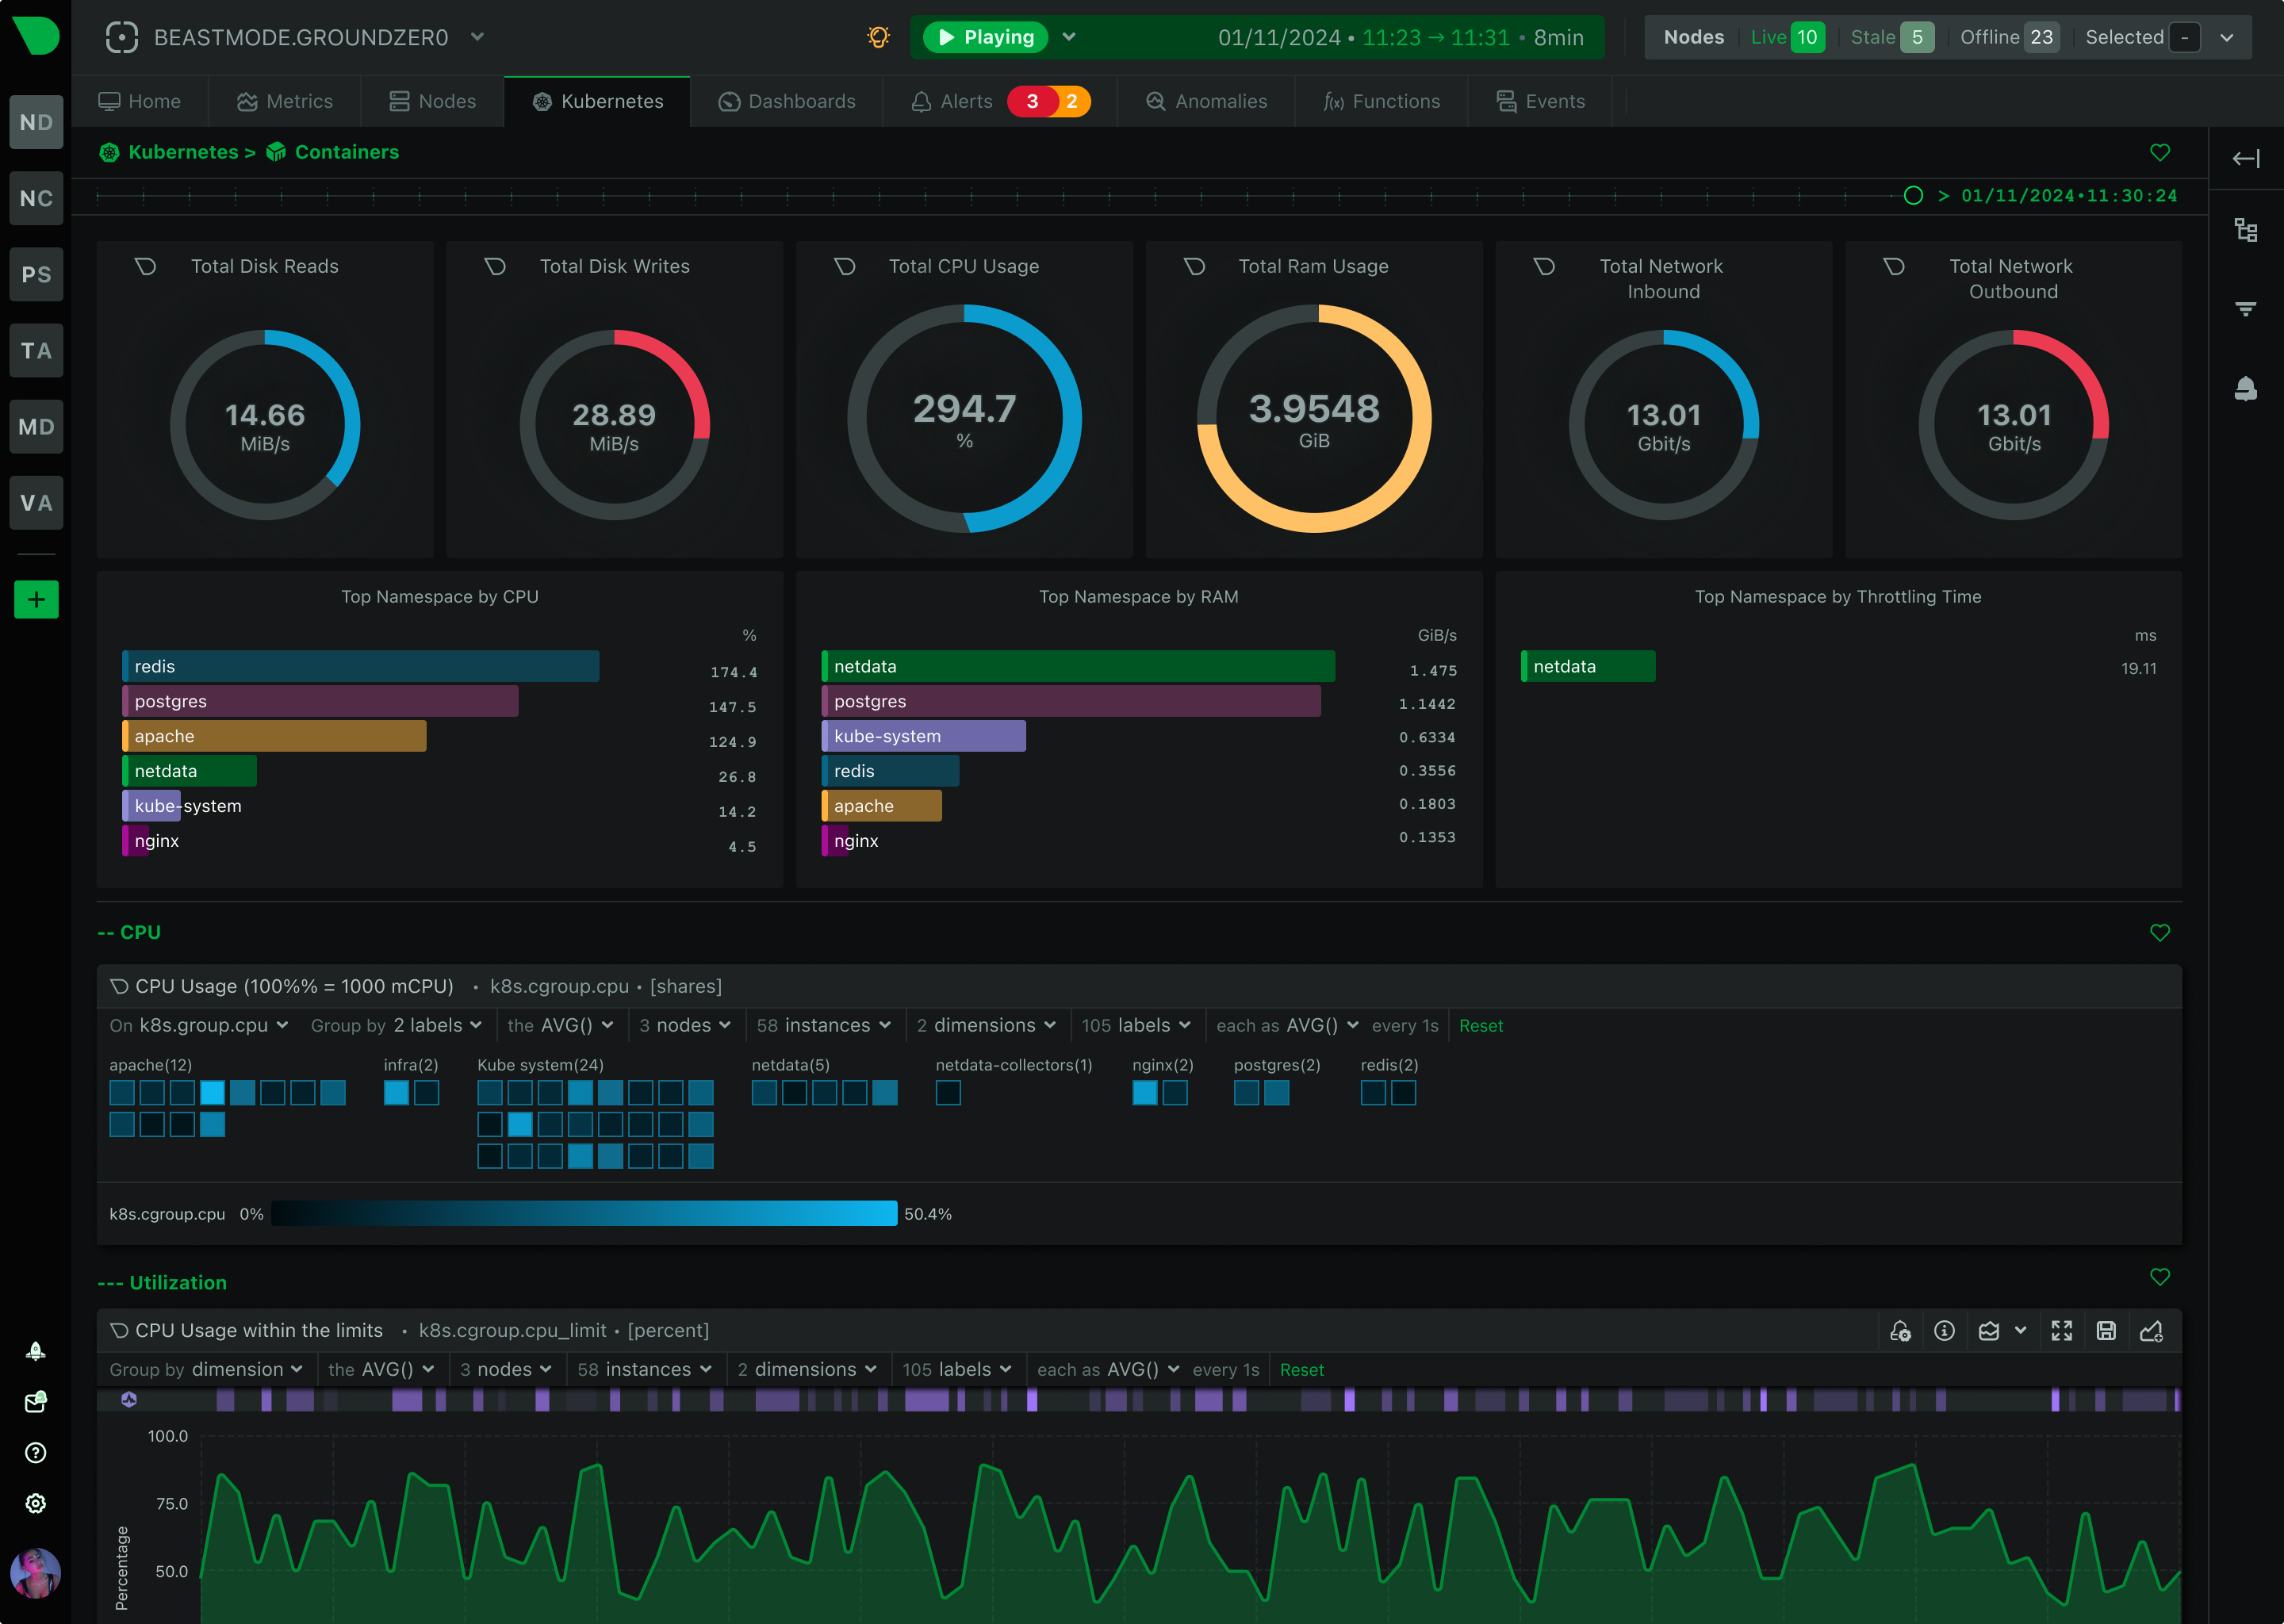
See everything—from bare metal to multi-cloud—in real time. Slash MTTR by spotting anomalies before they escalate.
Monitor application performance, errors, and resource usage in real-time.
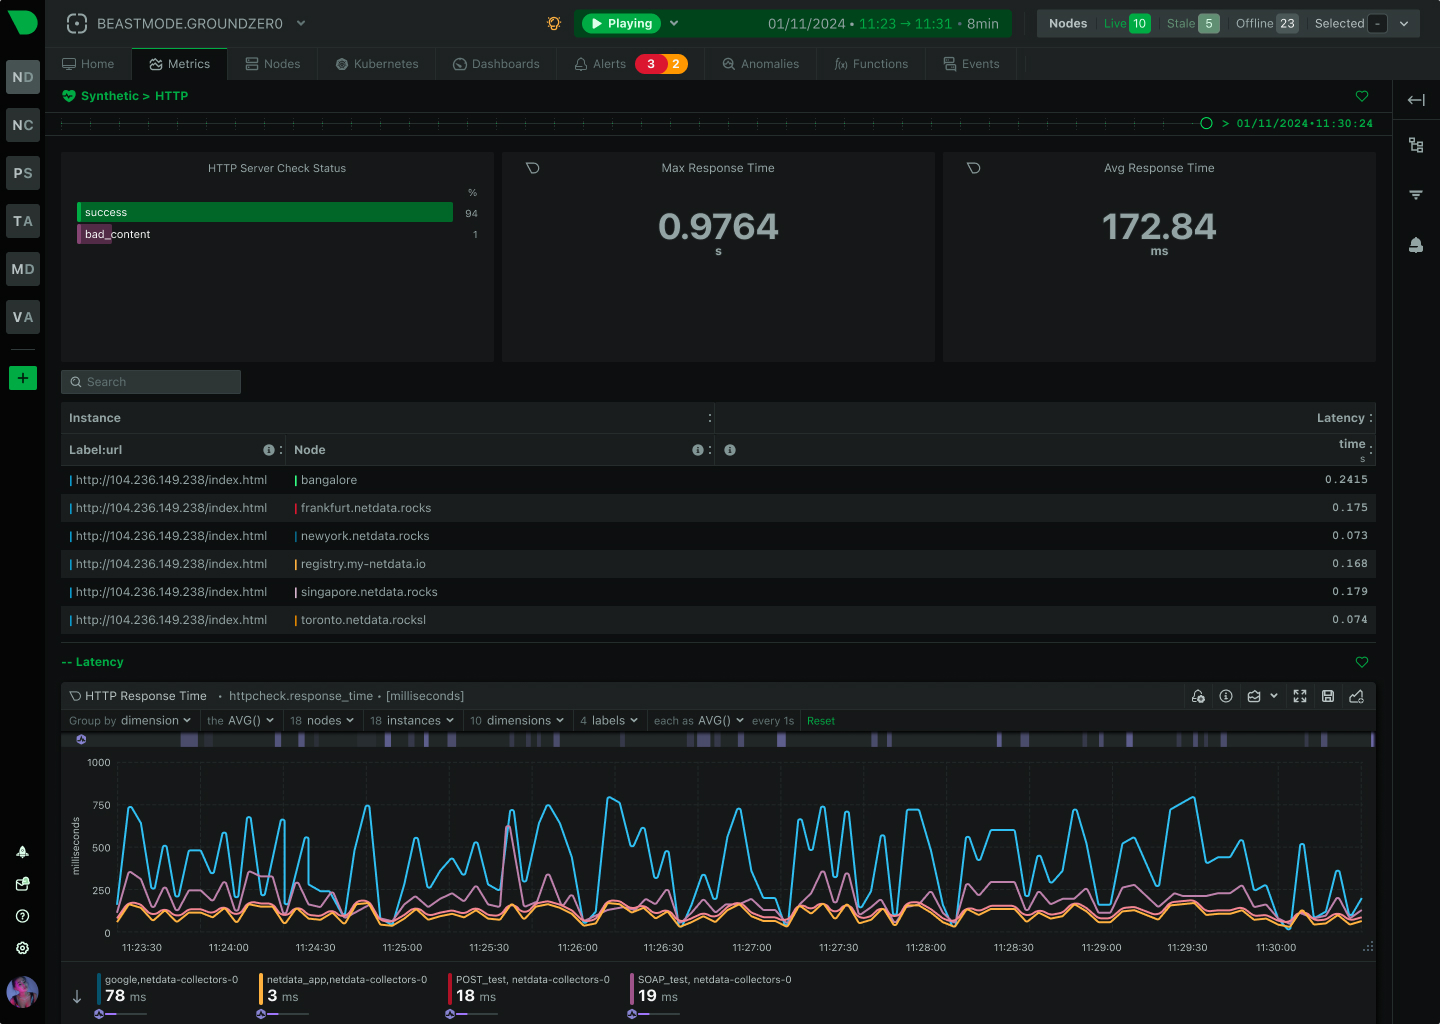
Simulate user interactions to proactively identify issues before they impact real users.
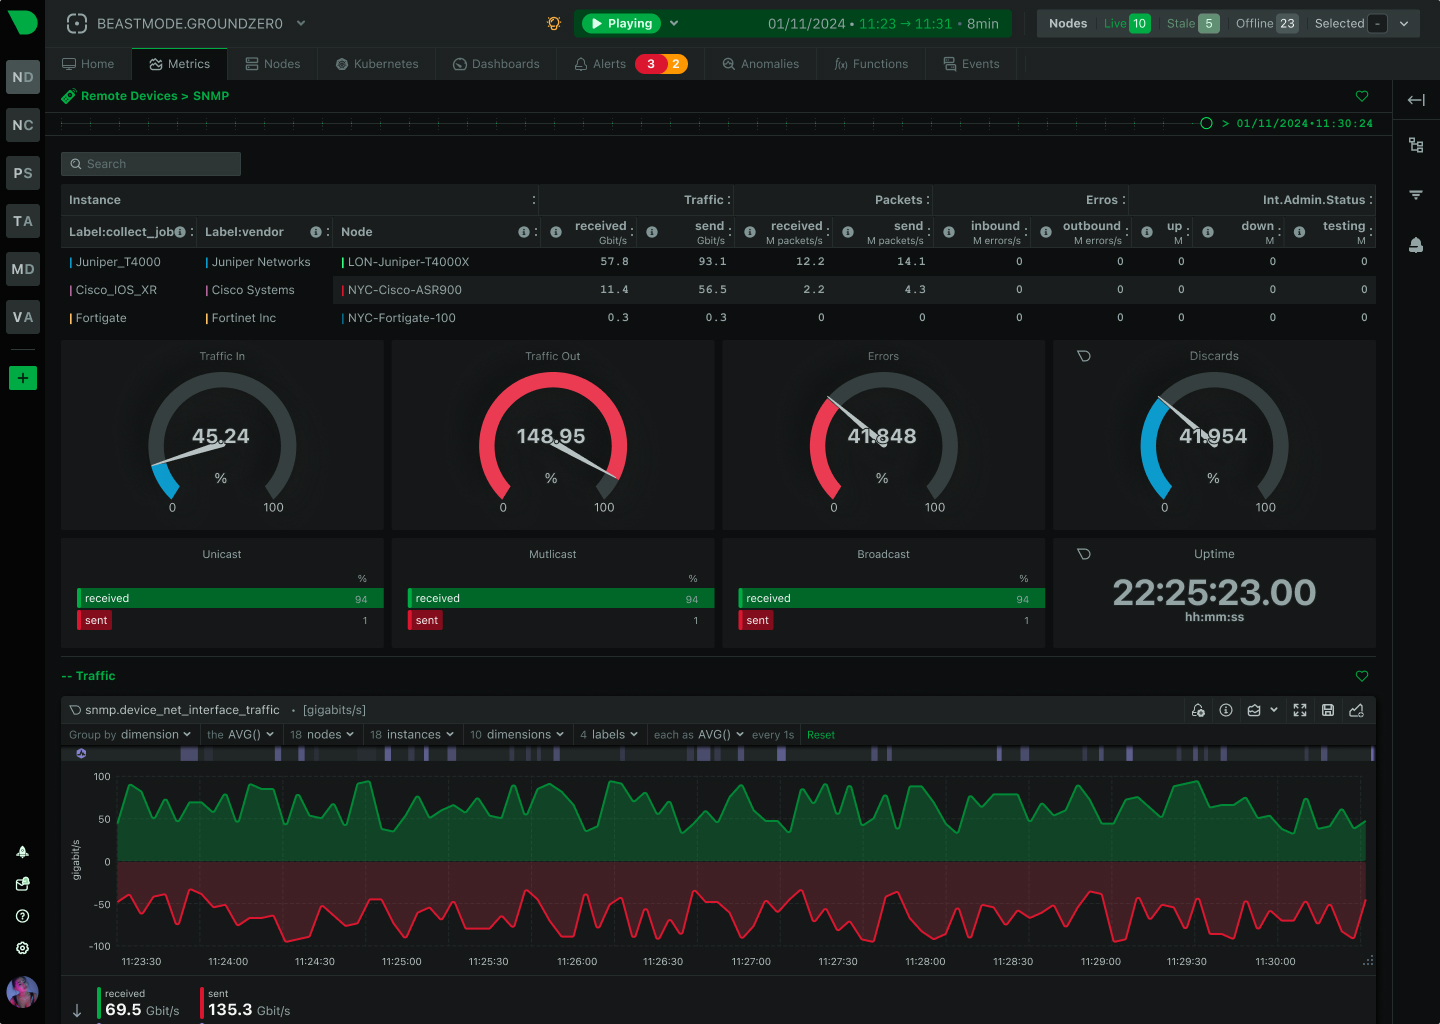
Track network performance, traffic patterns, and detect anomalies across your infrastructure.
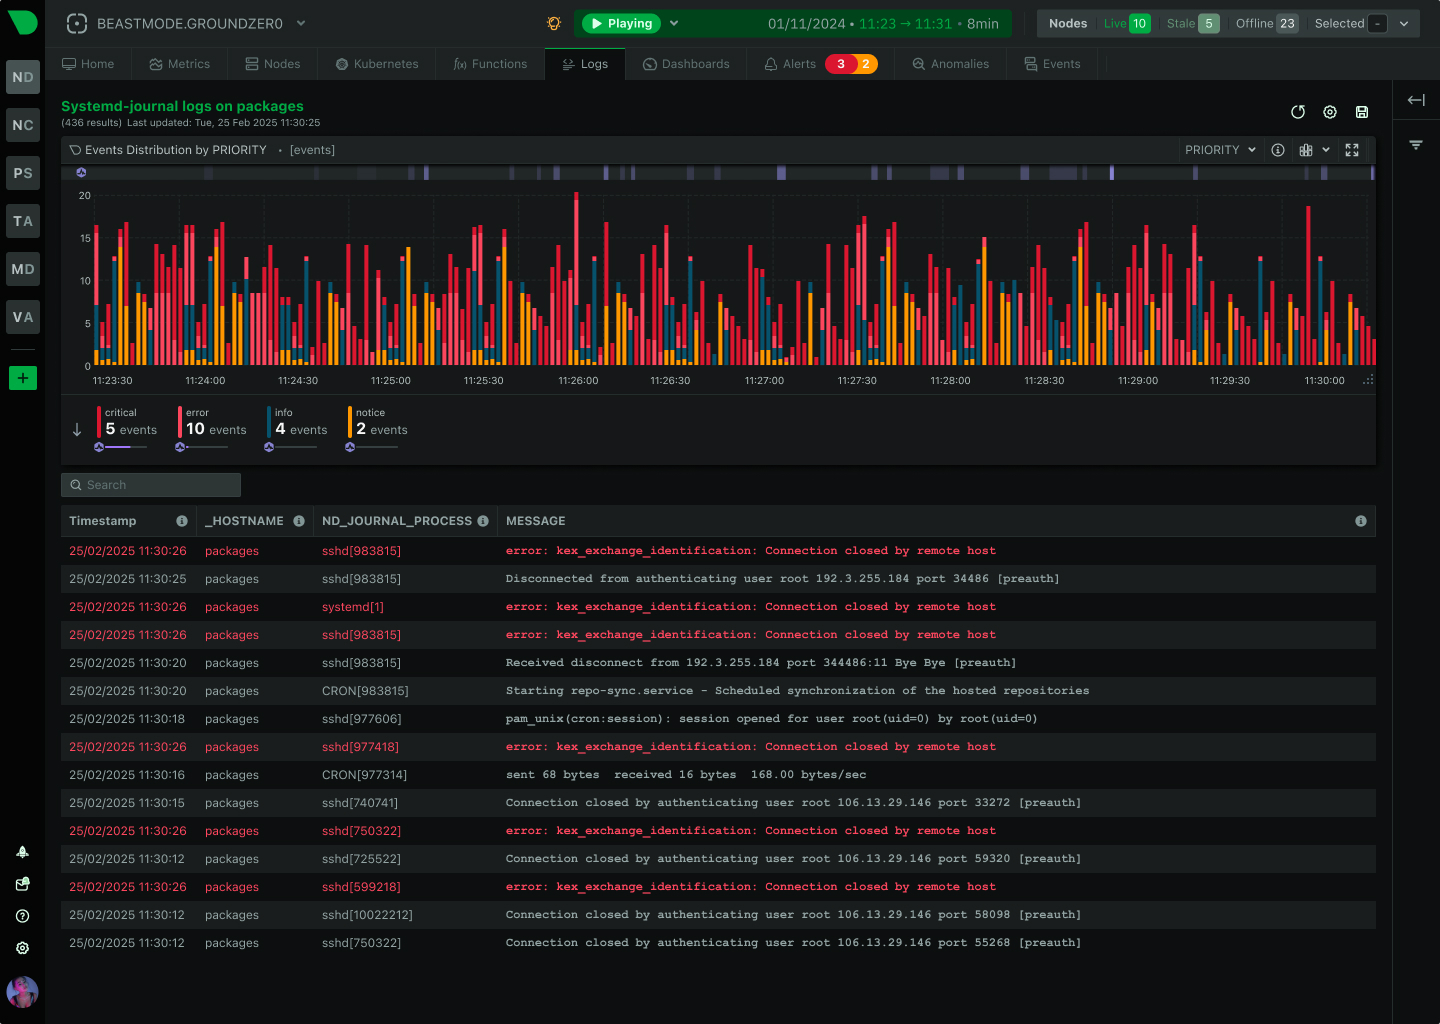
Centralized log management with powerful search and visualization capabilities.
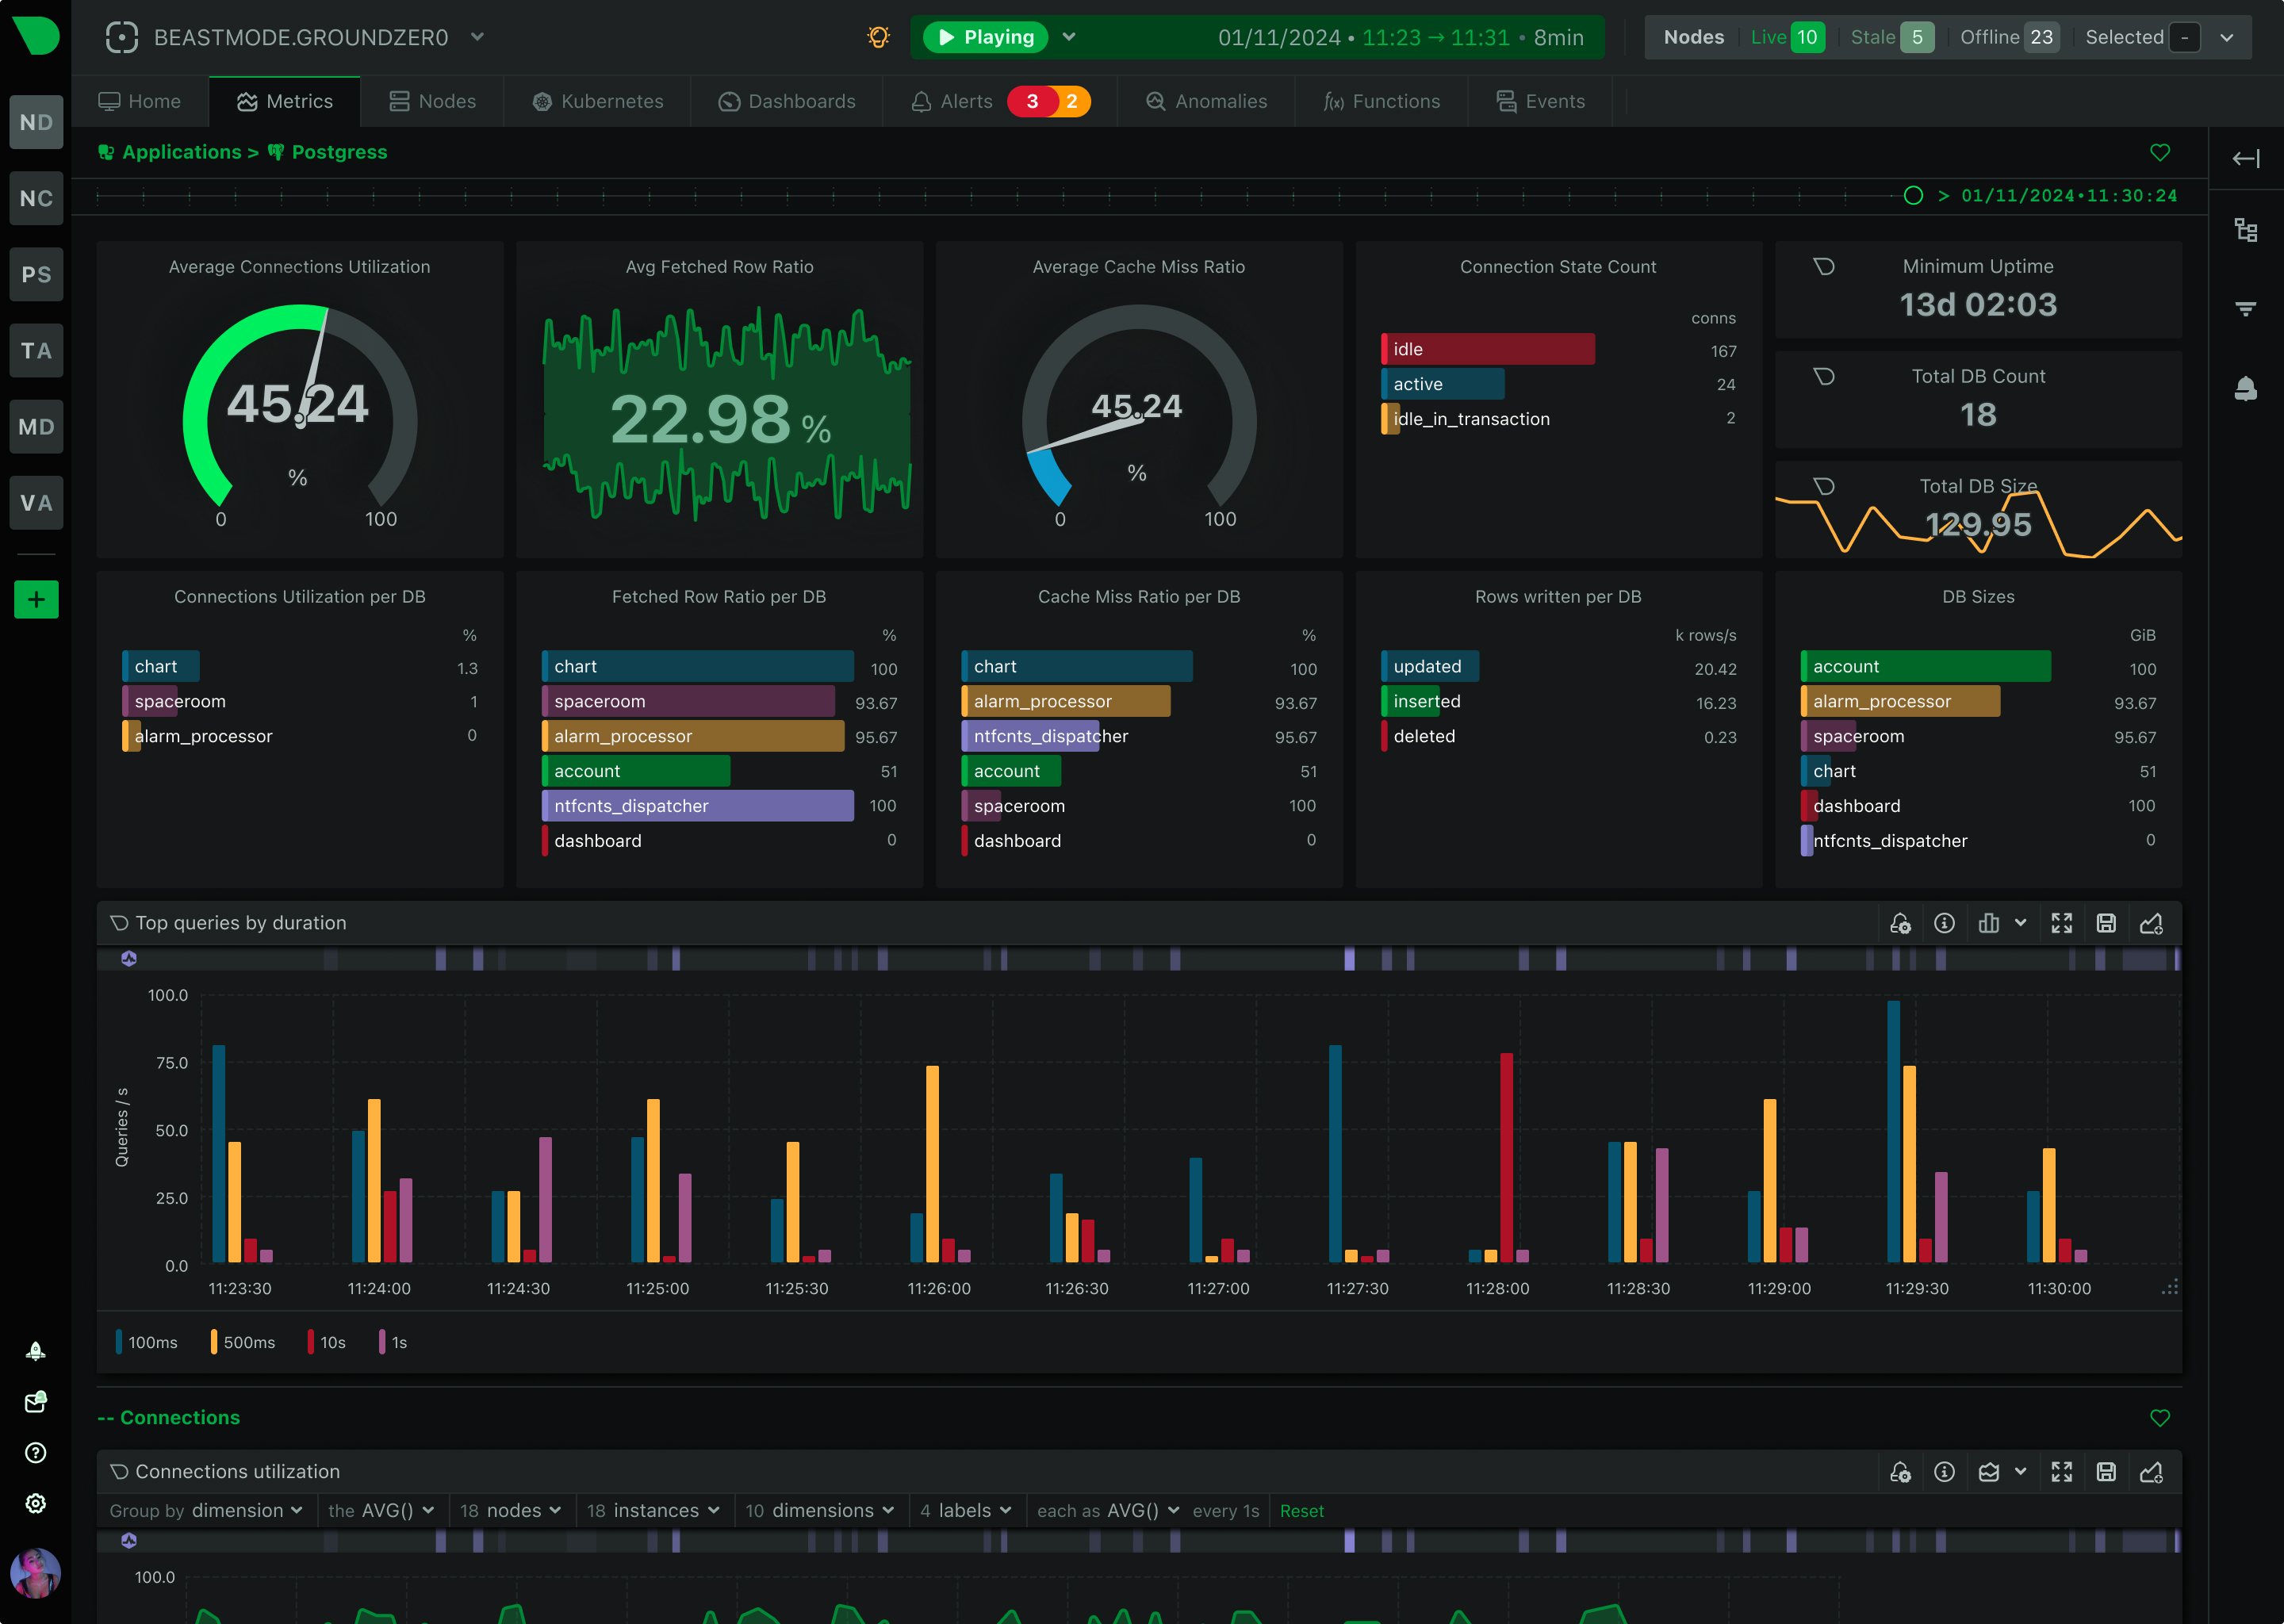
Collect, analyze, and visualize metrics from all your systems and applications.
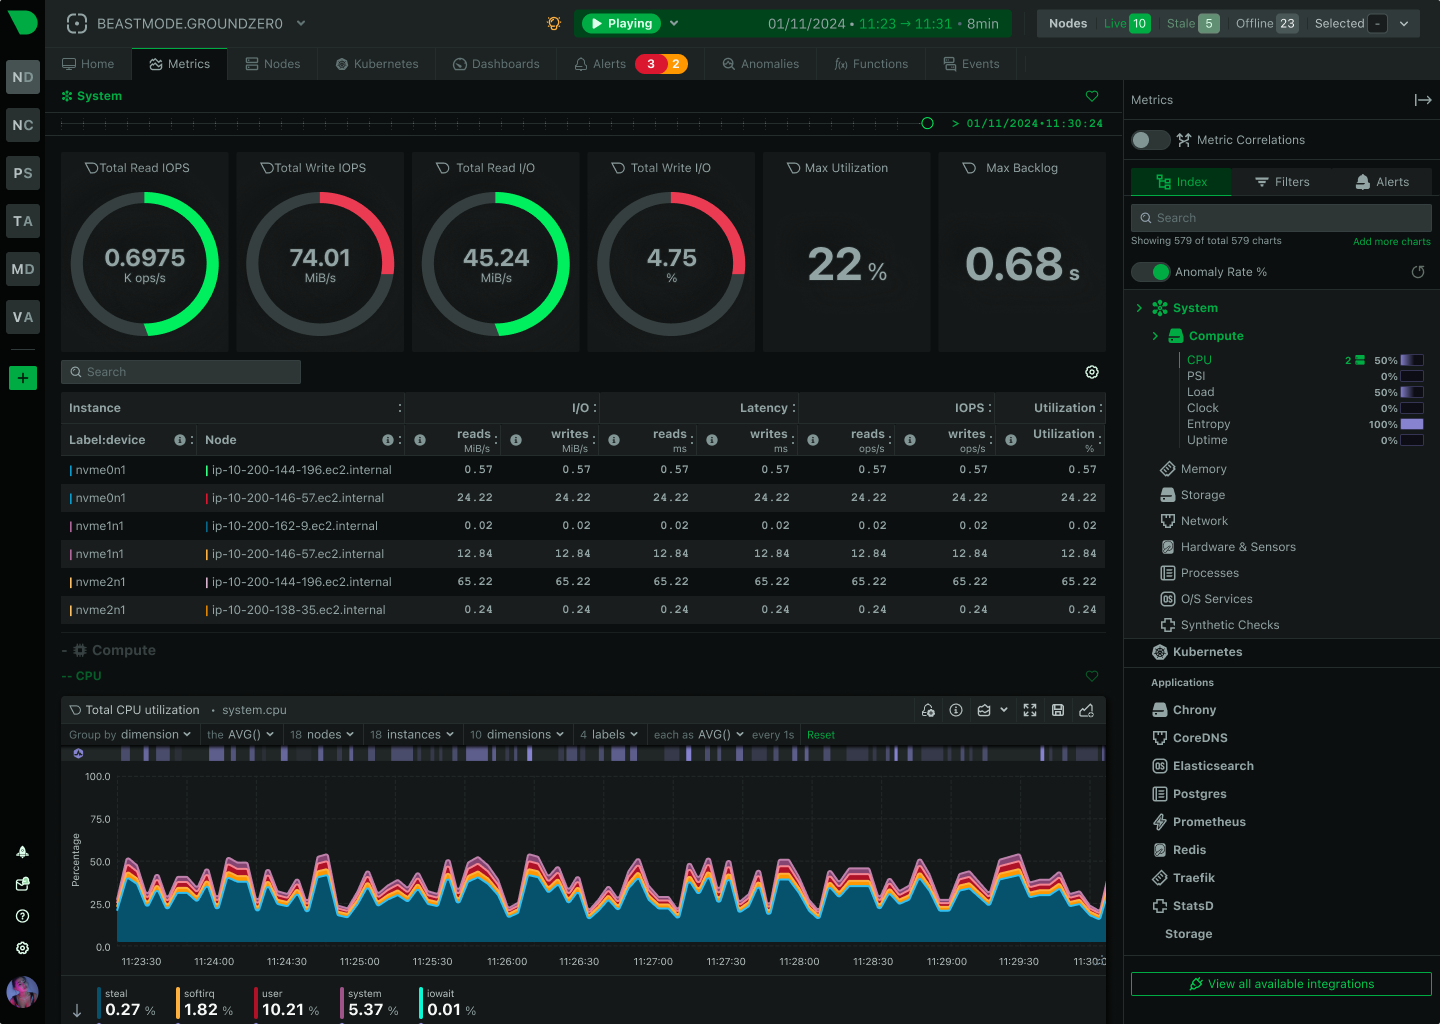
Monitor everything from bare metal to multi-cloud with Netdata's 800+ integrations that collect, visualize, and analyze every metric every second while maintaining complete data sovereignty and zero sampling.
Every metric. Every second. No BS.
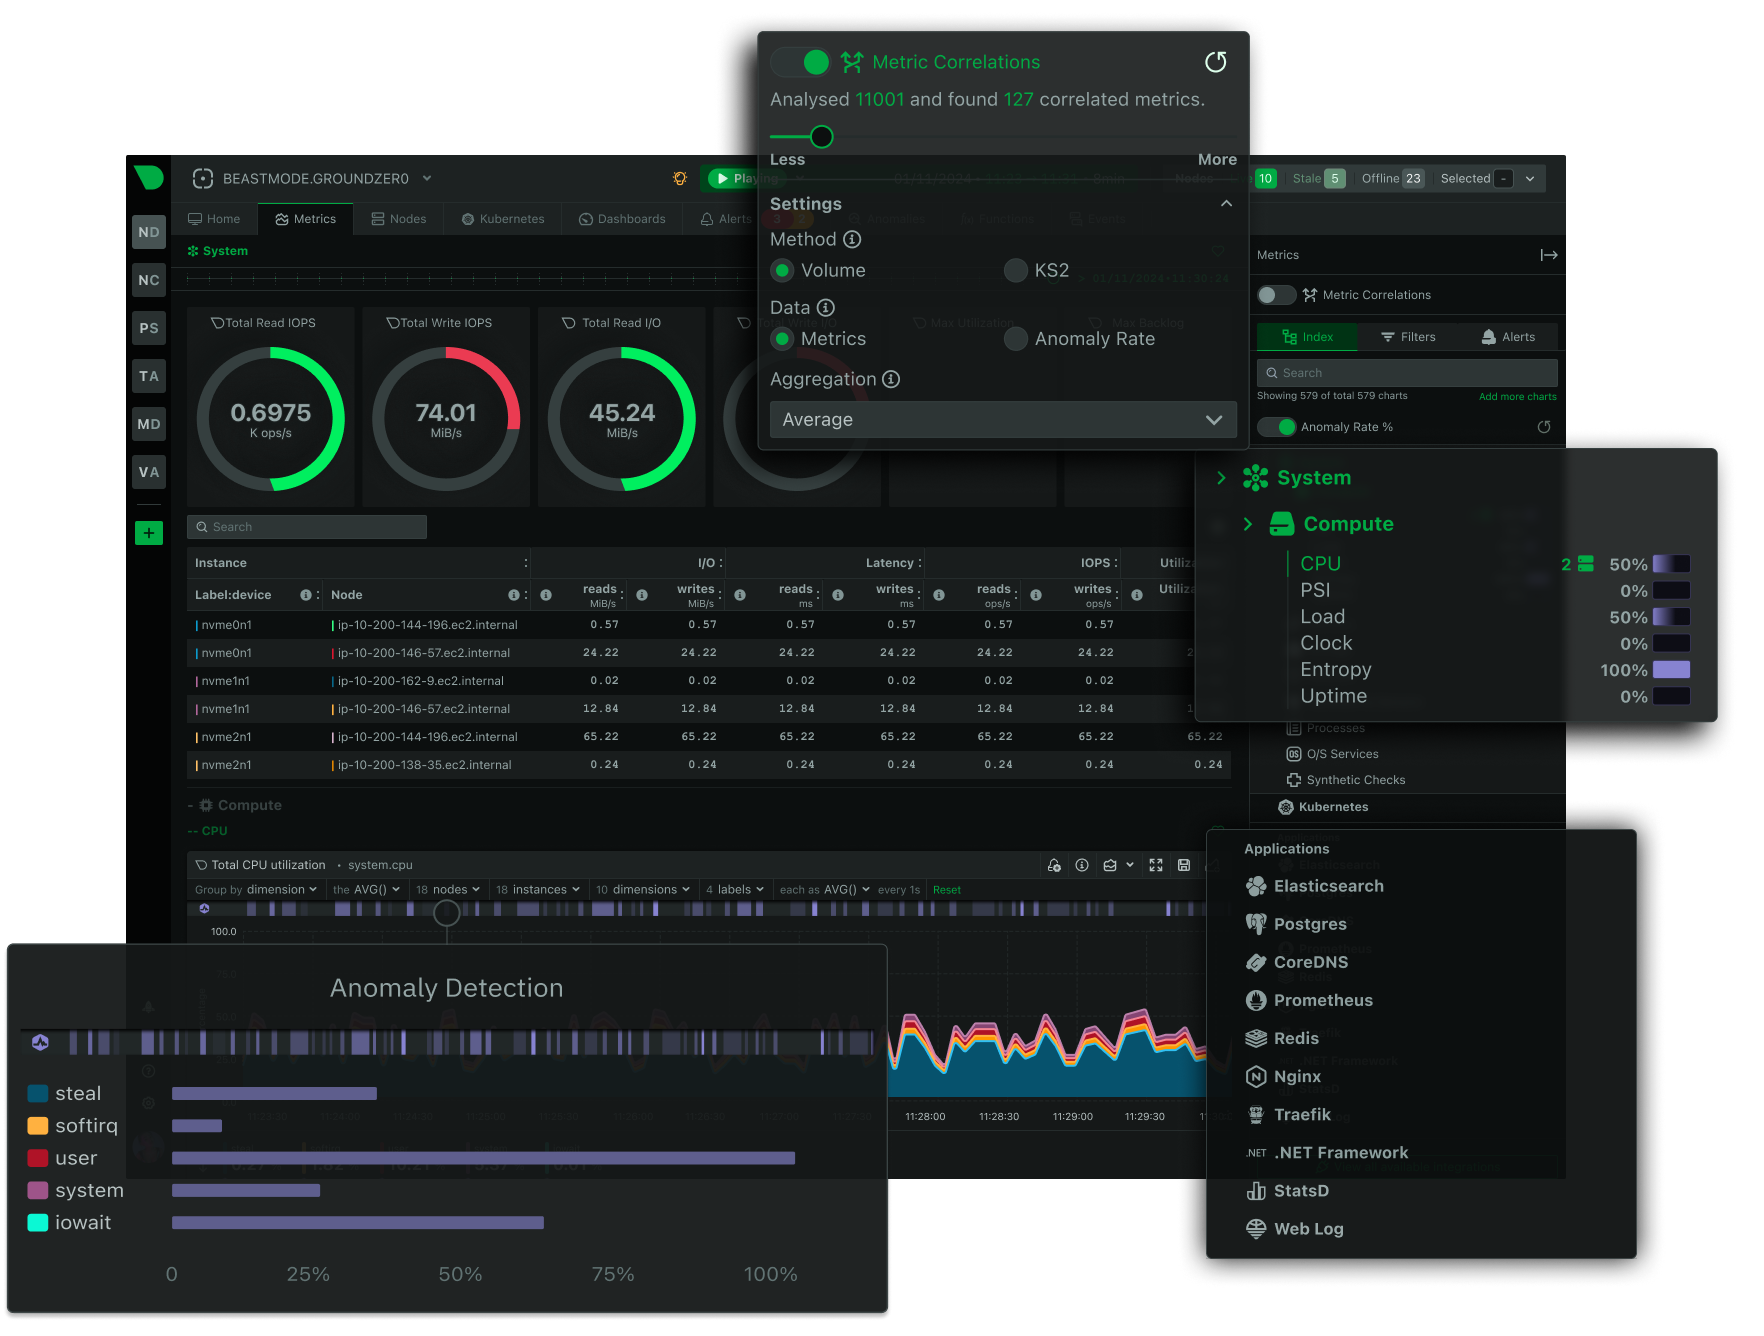
95% faster root cause analysis and MTTR, with advanced full automated ML, trained for every single metric, at the edge.
1800x more visibility with 30x more metrics collected per second.
40x better storage efficiency. 22x faster responses. 15% of the resources. Native horizontal scalability
Instead of centralizing the data, Netdata distributes the code, keeping all observability data as close to the edge as possible. This is the foundation of our performance and scale and offers 80%+ observability and cost reduction
A single pane of glass, eliminating 90% of admin console access in day-to-day operations.
Your data, at your premises.
Netdata's real-time insights, ease of use, and top-tier support have transformed how teams monitor and troubleshoot their systems. Here's how we've helped them stay ahead of outages and bottlenecks.

A Unified Approach to Monitoring a Heterogeneous Environment
View Case Study →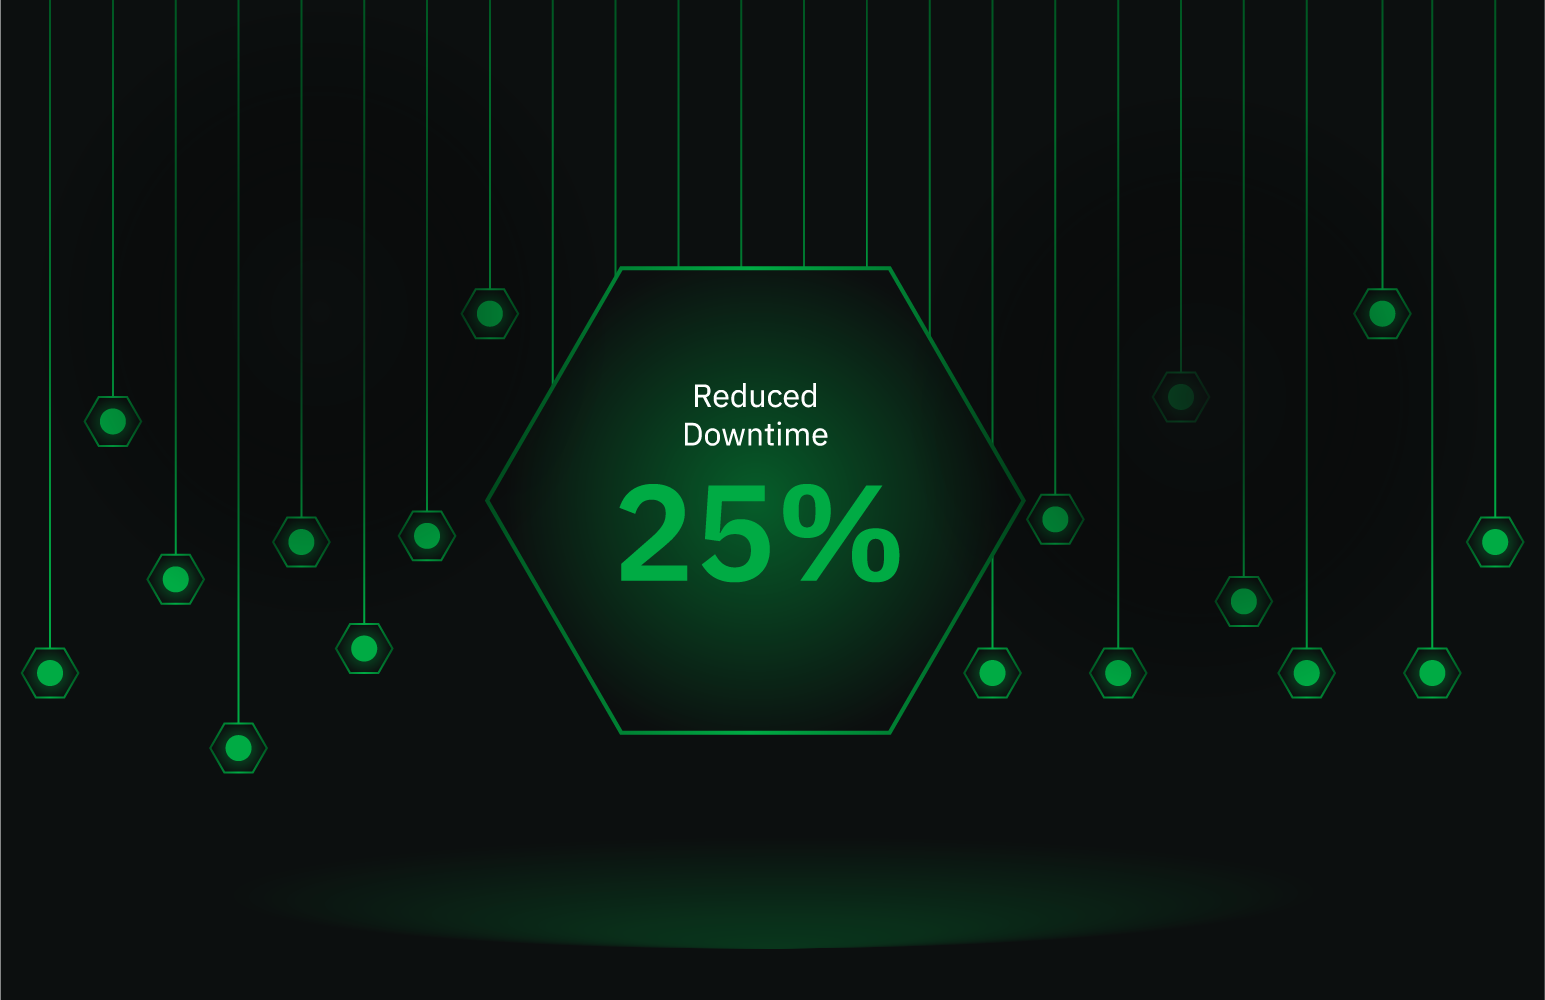
Enhancing Response Times and System Reliability
View Case Study →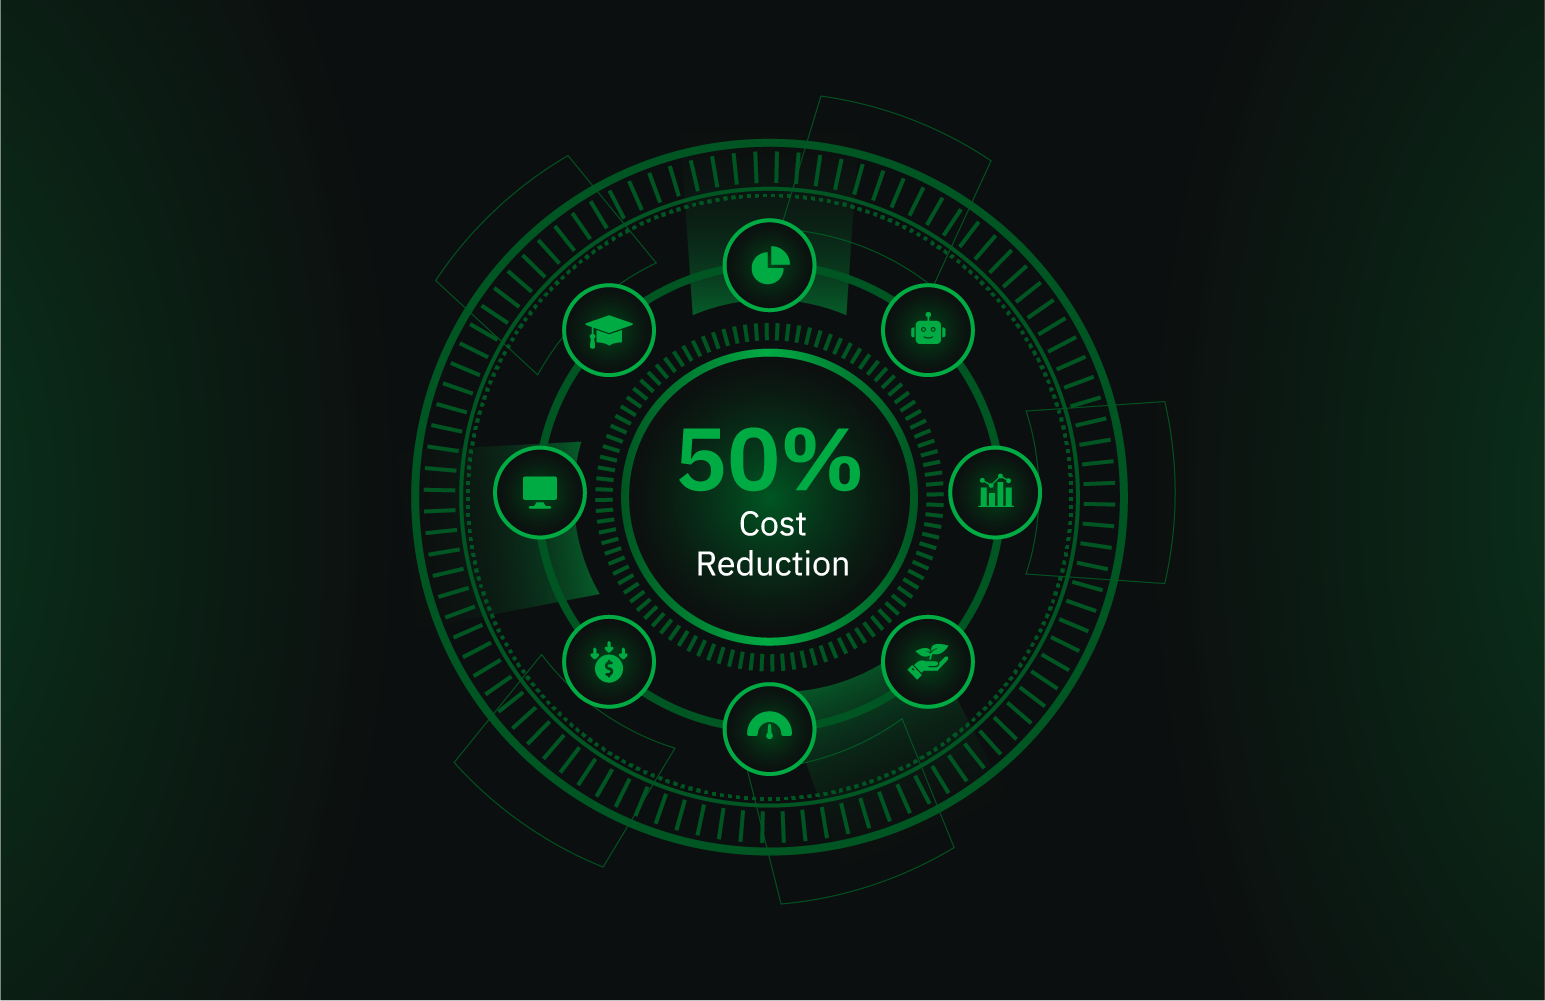
How Toyota Technological Institute Chicago Leverages Netdata
View Case Study →
How KAUST's Systems Research Group Reduced Downtime and Streamlined Troubleshooting with Netdata
View Case Study →
Enhanced Offline System Observability
View Case Study →
Falkland Islands Government's Journey with Netdata
View Case Study →Awards and reviews that reflect what really matters: performance, speed, and reliability


From industry certifications to client accolades, our achievements reflect our unwavering dedication to innovation and service