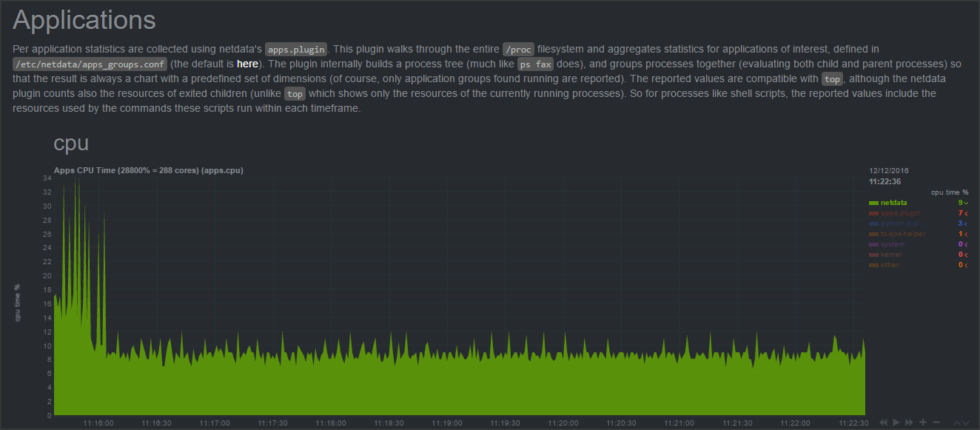
We’ve built a lot of amazing things into the open-source Netdata monitoring system. But, no matter how far we’ve come, we’ll always be proud of how little RAM it uses.
Right now, Netdata stores metrics in your system’s RAM using a ridiculously efficient database. It only saves or loads historical metrics from disk when you restart it. With this system, Netdata can be both low-resource and exhaustive in its collection of real-time metrics.
If you collect 1,000 metrics every second, and only need an hour’s worth of historical data, your instance of Netdata will use 14.4MB of RAM. If you want to collect a day’s worth data on 1,000 metrics, you’ll need 345MB of RAM. Or, you can push Netdata to its limits and collect 100,000 metrics for an hour and use a mere 1.7GB of RAM.

But what if you want to store weeks of metrics data at one-second granularity? Or months? Or years?
Enter our new database engine.
Sleek, smart, and even more efficient
The new DB engine gives Netdata users the option to store compressed metrics data for more extended periods than the RAM-only database can offer. We released the first version on May 22, 2019, with the v1.15.0 release of Netdata.It works like a traditional database by using a certain amount of RAM for data caching and indexing, while then sending the rest of the data to disk in a compressed format. Because the DB engine sends historical metrics data to disk, it can help you store a much larger dataset than the amount of RAM your system has.
How much? Let’s take a look at some examples.
With a typical compression ratio of 80%, each metric (when collected every second), will require 25MiB for an entire year. Random metrics are less compressible, and thus will take up 135MiB/metric/year, again at that 1-second granularity.
Given a machine collecting 1,000 metrics every second, you’d need 25,000MiB (24.4GiB) of disk space to hold an entire year’s worth of data.
Or, let’s say you have a large server, and Netdata is collecting 2,000 metrics every second. Given an average 80% compression ratio, the default 256MiB of disk space will hold about two day’s worth of metrics.
Our testing shows the DB engine will require an amount RAM equal to about 3% of the uncompressed disk space taken by the files on disk. That’s on top of the amount you’ve explicitly set with the page cache size setting, which defaults to 32MiB right now.
The DB engine probably won’t help you collect thousands of highly granular metrics in perpetuity, but it’s still exciting new territory for the Netdata team.
If you want to dig into the details, check out our documentation on the DB engine.
How will the DB engine help you?
If you already use a backend to archive your metrics data for long-term storage or backup, you may be able to use the DB engine instead. That simplifies your monitoring stack and allows you to use a single web dashboard to compare today’s metrics with yesterday’s or last month’s.If you use Netdata standalone, you should be able to store more metrics data without taking up too much RAM or creating a ton of disk I/O to write metrics as they come in. That’s pretty neat, too.
That’s the beauty of the new DB engine—it makes Netdata better, no matter who’s using it.
The shining future of the DB engine
Right now, the new DB engine is just one of the many memory mode options. Whilesave is the current default, we plan on making dbengine the default in the future.When we released the first version of the DB engine with v1.15.0, we weren’t happy enough with its performance. That’s why we reduced the memory footprint by 50% for the v1.16.0 release. With memory use dramatically reduced, we’ve turned our attention to a few other items on the TODO list that will make dbengine even more flexible and robust.
The first item on the priority list is reducing the memory footprint even further while making the engine more robust in complex use cases.
Currently, you can’t change your data collection frequency without losing some or all of the metrics data that’s currently being stored. DB engine may lose some of its accuracy, and other memory modes discard it entirely. We’re working to change that with an upcoming release.
Since your collection requirements might change over a year, we want to ensure you can always access the metrics you collected before but aren’t currently. Right now, Netdata can only query metrics that it actively collects, but we’re working on queries for ephemeral or obsolete metrics.
And for those large servers with lots of metrics, we’re developing a way to progressively thin your data by aggregating the oldest metrics and reducing their frequency. Thinning and tiering should minimize disk space requirements and help you cover even longer periods.
And while we’re still working on those features, the DB engine is fully functional right now. If you’d like to try it out on your Netdata agent, you can set the memory mode in netdata.conf:
[global]
    memory mode = dbengine
The most important options are page cache size and dbengine disk space:
[global]
    memory mode = dbengine
    page cache size = 32
    dbengine disk space = 256
The page cache size option sets the maximum amount of RAM (in MiB) that’s dedicated to caching metrics values. And with the dbengine disk space option, you set how much disk space (in MiB) you’d like to dedicate to storing historic values and their metadata. Be sure to read our documentation on the DB engine as well to understand what the configuration settings are and how best to use them.
Once you’ve enabled the new DB engine, you’ll be able to scrub backward in time much further, and without using many more system resources than before. DB engine is the best of both worlds, and it’s only going to get better with time.
We’re excited to get more real-world data from the Netdata community as they enable the new DB engine and start storing metrics for the long haul. If you have some numbers you’d like to share, you can ping us on Twitter, on a GitHub issue, or at [email protected].


