


As part of a modern software development team, you’re asked to do a lot. You’re supposed to build faster, release more frequently, crush bugs, and integrate testing suites along the way. You’re supposed to implement and practice a strong DevOps culture, read entire novels about SRE best practices, go agile, or add a bunch of Scrum ceremonies to everyone’s calendar. Every week, the industry recommends that you “shift-left” another part of the DevOps pipeline, to the point where you’re supposed to handle everything from unit testing to production deployment optimization from day one.
While you might have some experience in monitoring software, the reality is that as an aggregate, some others around you probably don’t. According to the Stack Overflow Developer Survey 2020, nearly 40% of developers have less than 5 years of professional experience. There’s not enough time for anyone to learn all these DevOps tools and best practices while also putting meaningful code into a GitHub repository on a regular basis.
Monitoring, and the metrics data it creates, can be a powerful way to encourage DevOps best practices through a common language, and implementing it doesn’t have to be complicated or time-consuming. By combining a DevOps mindset with a “full-stack” monitoring tool, you can start getting instant feedback about the performance and availability of what you’re trying to build—without waiting another 5 years for your team’s DevOps experience to catch up.
If your team has already settled on a monitoring tool, you can start applying these best practices today. If you’re still looking for the right piece of kit, you can start making informed tooling decisions based on what’s going to strengthen your team.
Focus on infrastructure monitoring first
When we talk about monitoring software for DevOps teams, we’re talking primarily about infrastructure monitoring. Infrastructure monitoring is the practice of collecting metrics data about the performance and availability of an application’s “full stack.” That’s everything including the hardware, any virtualized environment, the operating system, and any services (like databases, message queues, or web servers) that might make your application possible.Depending on the full stack’s complexity, infrastructure monitoring can mean keeping an eye on a single virtual machine (VM) running on Google Cloud Platform (GCP), a Kubernetes (k8s) deployment with dozens of ephemeral nodes that scale horizontally during periods of high usage, or anything in between.
Here’s some key infrastructure metrics to keep an eye on using your monitoring tool (Netdata included):
- Resource utilization (CPU, memory, disk IO)
- System load
- Virtualized environments (Docker, Linux containers)
- Uptime
- Response times for each mission-critical component
- Per-application and -user metrics
- Web server-specific metrics (requests, error rates)
- Database-specific metrics (cache, connections, query types)
- Metrics for any other service that runs your stack
Monitor performance and availability in every environment
Modern DevOps teams should be monitoring the full stack no matter where it runs. This presents quite a large break from tradition, where the operations (Ops) team handled monitoring only once the application was running in production. The perception was that seeing users interact with a full stack was the only way to catch real bugs.The latest best practices acknowledge that it’s possible—even inevitable—to catch bugs early by monitoring everywhere. That starts with local development servers and extends to any number of testing, staging, or production environments. That also means the monitoring tool should work whether the application is running off the latest M1 Macbook Air or in a multi-cloud deployment across dozens of virtual machines (VMs).
Before you go rushing into your next release process, take time to develop the tooling to monitor in more places. That might mean creating a custom Dockerfile for local development, or adding hooks into your CI/CD toolchain to deploy a fresh staging environment every time a developer reaches a milestone.
How’s this for an easy deployment experience in any environment?
Collect everything, worry about it when you need it
The only way to know that something is going wrong with your application’s infrastructure is to have the data to support it. One common practice is to vacuum up every metric, store it for 2-3 weeks, and have it available if you need to go back in time and root cause an issue or outage.One way to ensure you’re collecting everything is to choose a tool with high granularity. Every infrastructure monitoring tool collects and visualizes metrics at a specific granularity, which is another way of talking about the time period between one point of collection and the next.
One data point every 60 seconds = low granularity One data point every 1 second = high granularity If you have a transitive-but-critical error that comes and goes within 5 seconds, a low-granularity solution might not even show a blip, which means you still don’t know anything went wrong in the first place.
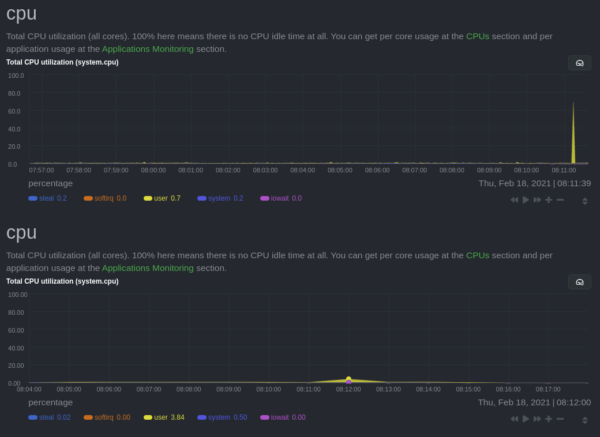
With low granularity, metrics are averaged out over long periods of time, which has the unwanted effect of flattening what should be a worrying spikes into nothing more than a blip in the noise.
Netdata itself uses an internal time-series database for storing per-second metrics in an efficient way, which gives you tons of flexibility to find the sweet spot between disk space considerations and keeping historical metrics around long enough for proper analysis.
Some DevOps teams even use tools like (e)BPF, which collect and visualize metrics with an event granularity, which means they can show you every event, and not just an average/minimum/maximum of data between two points in time.
Break down silos with metrics
One of the DevOps mindset’s core purposes is to break down existing silos between what used to be separate development (Dev) and operations (Ops) teams. In the past, the Dev team finished writing code, flung across the fence to the Ops team, and wiped their hands clean from whatever came next. The Ops team then spent their days putting out fires and understanding how the application worked.DevOps is designed to stop this unproductive cycle, but it only works if everyone has access to the same platform and uses the same language: metrics. Choose a tool that’s accessible to everyone who touches application code or controls the production environment. That doesn’t mean having one person who controls the infrastructure monitoring dashboards and lets the rest of the organization look at it in read-only mode.
Make sure your monitoring tool encourages the sharing of information. Let anyone on your team, no matter their role, peek at your configurations or dashboards. By looking over your shoulder, they might learn something valuable, like a metric they’d previously overlooked or a unique troubleshooting strategy. On the other hand, the tool should also let anyone experiment and explore in a “sandbox” that doesn’t affect the core health and availability dashboards.
For example, Netdata Cloud uses the concepts of War Rooms, which are shared containers for DevOps teams who need to do infrastructure monitoring. Every node, alert, and custom dashboard in that War Room is shared between everyone, but each team member can freely create, reconfigure, and learn. No more keys to the dashboarding kingdom, and no more worrying about messing up someone else’s perfectly-crafted troubleshooting experience.
Bubble it up into continuous monitoring
While continuous integration (CI) and continuous delivery (CD; CI/CD) have gotten all the attention, a lot of DevOps practitioners have forgotten about continuous monitoring (CM). This practice helps DevOps teams track, identify, and make decisions from all collected metrics, across all environments, in real time.While some consider CM the last part of the DevOps pipeline—the practice of monitoring an application in production—other organizations bring CM to the entire CI/CD toolchain, monitoring internal processes and tooling to identify issues before being released into the wild.
With a sophisticated CM strategy in place, your team can better respond to ongoing incidents, with the added benefit of making leaps in the 4 key metrics for DevOps success: mean time to acknowledge (MTTA), mean time to recovery (MTTR), mean time between failures (MTBF), and mean time to failure (MTTF). You’ll improve company-wide visibility into the performance and availability of its stack, and you’ll end up driving real business results, like happier users and improved retention. Because Netdata deploys (easily) everywhere, has highly-granular metrics, and lets users of all experience levels explore and learn their infrastructure, it’s perfect for leveling up a DevOp team with CM.
Don’t have a DevOps monitoring tool yet?
The IT infrastructure monitoring tools that make all these best practices come to life come in a huge variety of shapes and sizes, from open-source toolchains you cobble together on your own to enterprise-friendly monoliths that do everything but cost a ton.Because there are so many moving parts, a lot of developers and DevOps teams hesitate when choosing an IT monitoring tool, and then end up with something that doesn’t actually empower them, knock down silos between teams, or ramp up the speed of development.
One choice that enables all of the above best practices, and many more, is Netdata. Download the free and open-source Netdata Agent to start implementing DevOps best practices and improve team’s performance know-how with a free, open-source monitoring tool.
Once you’re seeing metrics with per-second granularity, familiarize yourself with Netdata’s documentation and guides to explore more opportunities to explore, troubleshoot, and resolve even the most complex of full-stack issues.