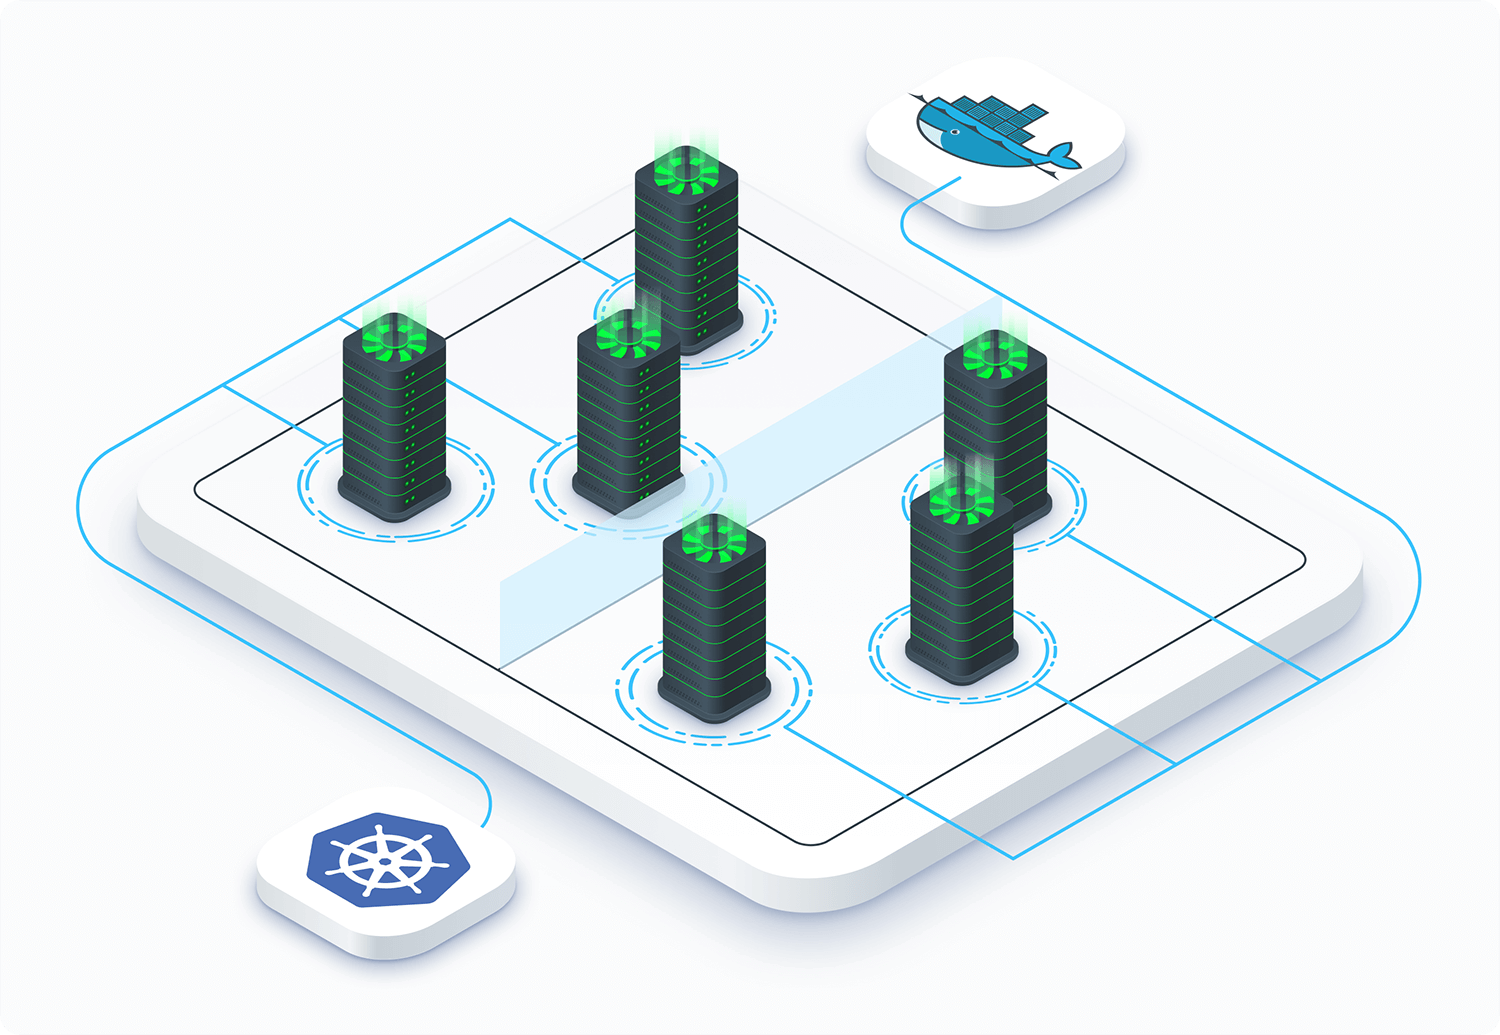
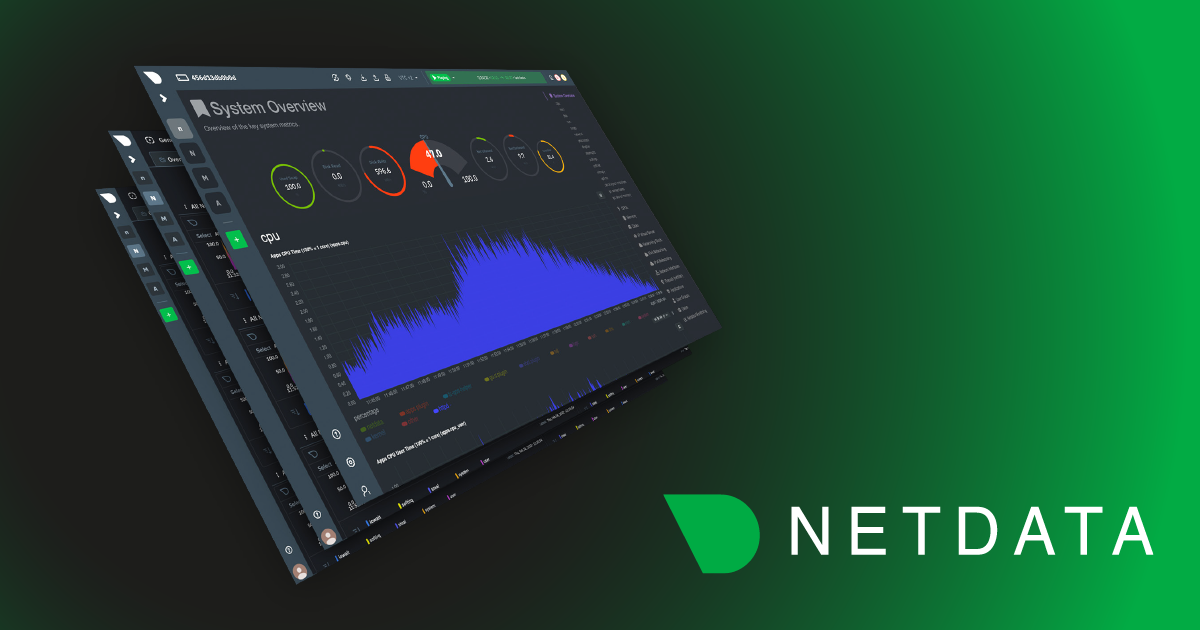
Properly monitoring the health and performance of Docker containers is an essential skill for solo developers and large teams alike. As your infrastructure grows in complexity, it’s important to streamline every facet of the performance of your apps/services. Plus, it’s essential that the tools you use to make those performance decisions work across teams, and allow for complex scaling architectures.
Netdata does all that, and thanks to our Docker container collector, you can now monitor the health and performance of your Docker containers in real-time.
With Docker container monitoring enabled via cgroups, you get real-time, interactive charts showing key CPU, memory, disk I/O, and networking of entire containers. Plus, you can use other collectors to monitor the specific applications or services running inside Docker containers.
With these per-second metrics at your fingertips, you can get instant notifications about outages, performance hiccups, or excessive resource usage, visually identify the anomaly, and fix the root cause faster.
What Is Docker?
Docker is a virtualization platform that helps developers deploy their software in reproducible and isolated packages called containers.
These containers have everything the software needs to run properly, including libraries, tools, and their application’s source code or binaries. And because these packages contain everything the application needs, it runs everywhere, isolating problems where code works in testing, but not production.
Why Use Docker For Container Monitoring
Docker containers are a popular platform for distributing software via Docker Hub, as we do for Netdata itself.
But perhaps more importantly, containers are now being “orchestrated” with programs like Docker Compose, and platforms like Kubernetes and Docker Swarm. DevOps teams also use containers to orchestrate their microservices architectures, making them a fundamental component of scalable deployments.
Why Monitor Docker Containers? Common Use Cases
Docker containers are lightweight and efficient, but without proper monitoring, they can become a black box. Here’s why monitoring matters:
Detect Performance Bottlenecks Early
Identify CPU spikes, memory leaks, and disk I/O issues before they affect your app or end-users.
Understand Behavior At Scale
In production or orchestrated environments, tracking metrics per container helps you analyze how services behave under load or during autoscaling events.
Ensure SLA & Uptime
Monitoring helps DevOps teams meet service level agreements by alerting them to resource saturation, restarts, or unexpected outages.
Optimize Resource Usage
Avoid overprovisioning by using metrics to right-size containers, reduce cloud costs, and prevent noisy neighbor problems.
Debug Faster
Drill into real-time or historical metrics to isolate issues in individual services, without needing to recreate the bug.
Whether you’re debugging a single-node app or managing a fleet of microservices, monitoring is critical to keep things running smoothly.
Docker Container Monitoring Made Simple With Netdata
Netdata uses control groups—most often referred to as cgroups—to monitor Docker containers. cgroups is a Linux kernel feature that limits and tracks the resource usage of a collection of processes. When you combine resource limits with process isolation (thanks, namespaces!), you get what we commonly refer to as containers.
Linux uses virtual files, usually placed at /sys/fs/cgroup/, to report the existing containers and their resource usage. Netdata scans these files/directories every few seconds (configurable via check for new cgroups every in netdata.conf) to find added or removed cgroups.
The best part about monitoring Docker containers with Netdata is that it’s zero-configuration. If you have Docker containers running when you install Netdata, it’ll auto-detect them and start monitoring their metrics. If you spin up Docker containers after installing Netdata, restart it with sudo service netdata restart or the appropriate variant for your system, and you’ll be up and running!
Read more about Netdata’s cgroup collector in our documentation.
Monitor Multiple Docker Containers In One Place
Netdata auto-detects running containers and auto-populates the right-hand menu with their IDs or container names, based on the configuration of your system. This interface is expandable to any number of Docker containers you want to monitor with Netdata, whether it’s 1, 100, or 1,000.
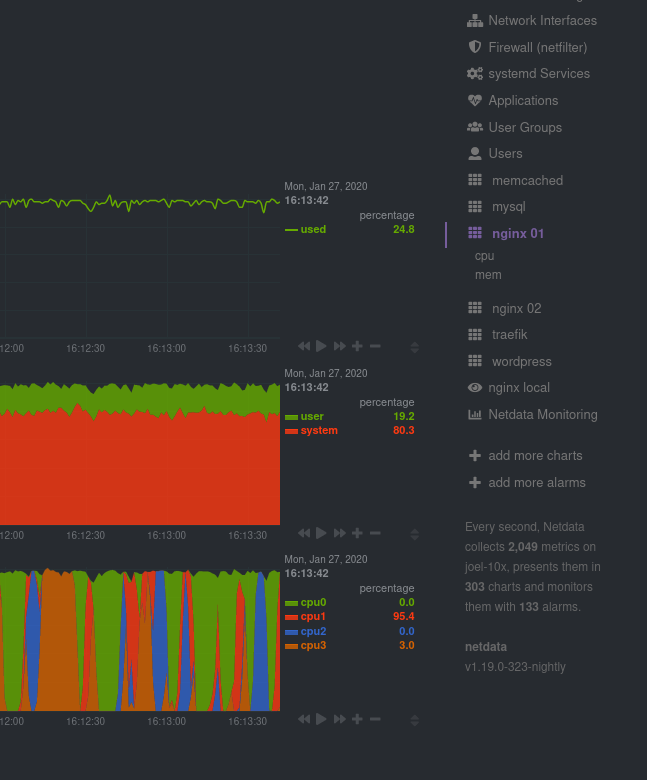
Netdata also uses its meaningful presentation to organize CPU and memory charts into families, so you can quickly understand which containers are using the most CPU, memory, disk I/O, or networking, and begin correlating that with other metrics from your system.
Get Three Alarms For Docker Container
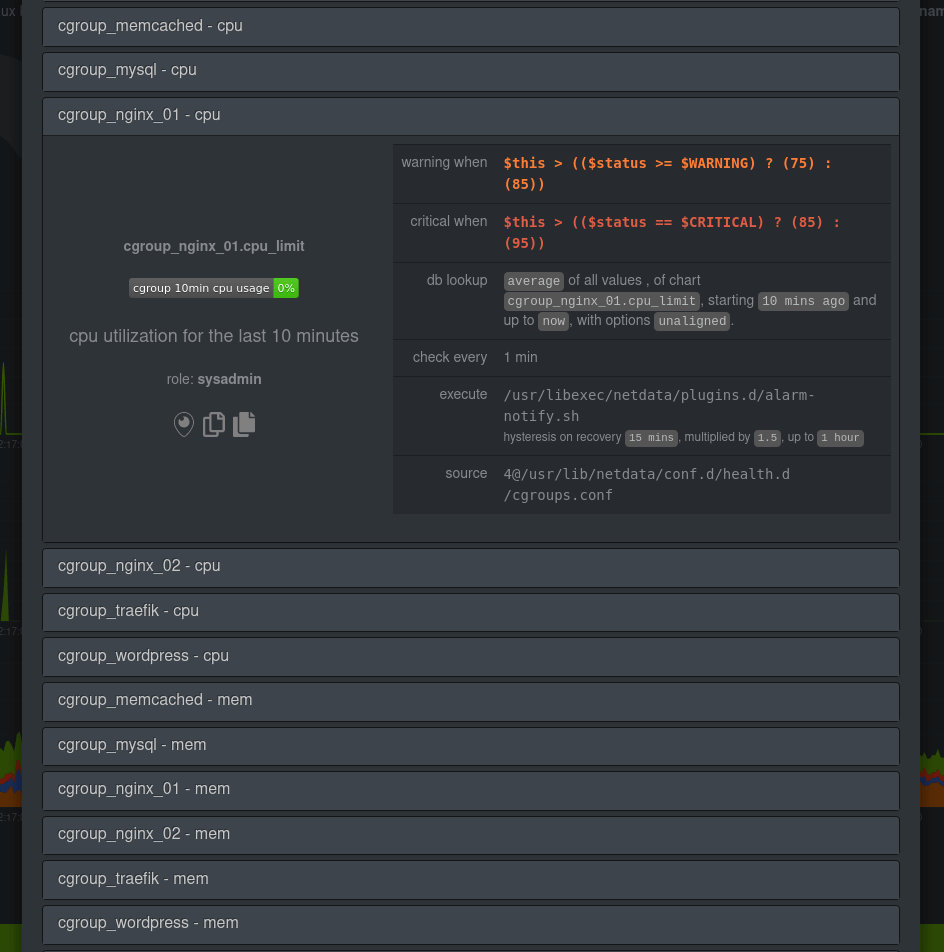
Netdata comes with pre-configured CPU and memory alarms for every running Docker container. Once Netdata auto-detects a Docker container, it initializes three alarms: RAM usage, RAM+swap usage, and CPU utilization for the cgroup. These alarms calculate their usage based on the cgroup limits you set, so they’re completely dynamic to any Docker setup.
You can, of course, edit your health.d/cgroups.conf file to modify the existing alarms or create new ones entirely.
Is Docker Monitoring Secure With Netdata?
Security is a key concern when monitoring containerized environments, especially in production.
Netdata was designed with this in mind:
Read-Only Access By Default
Netdata collects container metrics without requiring elevated privileges or modifying containers.
Minimal Footprint
The agent is lightweight and doesn’t expose unnecessary attack surfaces.
Secure Metrics Sharing
When connected to Netdata Cloud, all data is encrypted in transit, and only metadata, not full logs, is retained.
Container Isolation
Monitoring doesn’t interfere with container behavior. Metrics are collected externally via cgroups and system files.
For environments with stricter policies, Netdata can be configured to run with reduced permissions and within its own container for even greater isolation.
Docker Monitoring With Real Time Metrics Of Container Apps
Netdata’s Docker monitoring doesn’t stop with entire containers—it’s also fully capable of monitoring the apps/services running inside those containers. This way, you’ll get more precise metrics for your mission-critical web servers or databases, plus all the pre-configured alarms that come with that collector!
You can monitor specific metrics for any of the 200+ apps/services like MySQL, Nginx, or Postgres, with little or no configuration on your part. Just set the service up using the recommended method, and Netdata will auto-detect it.
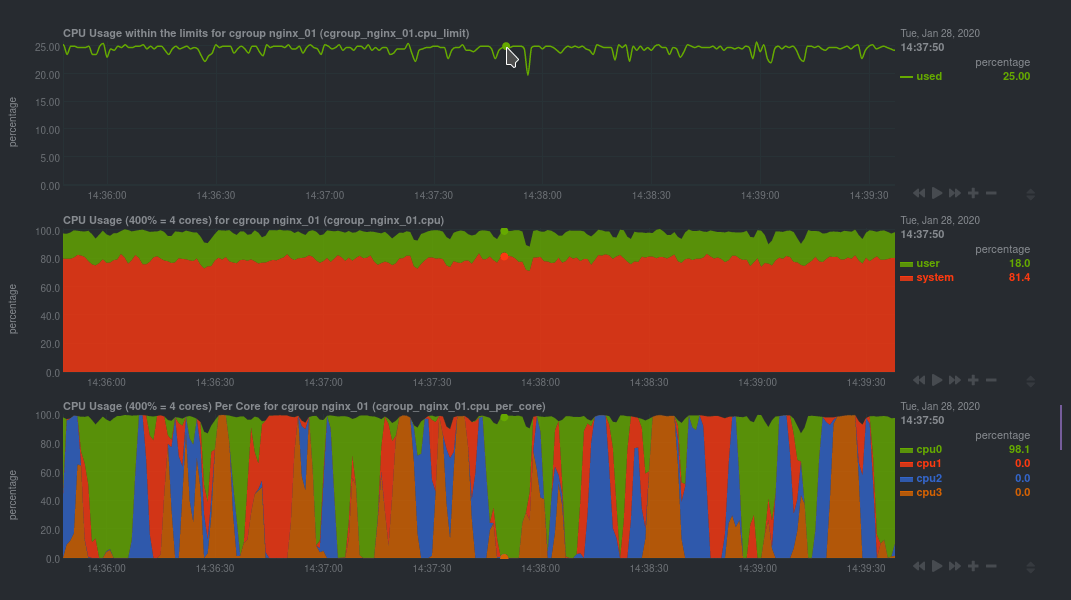
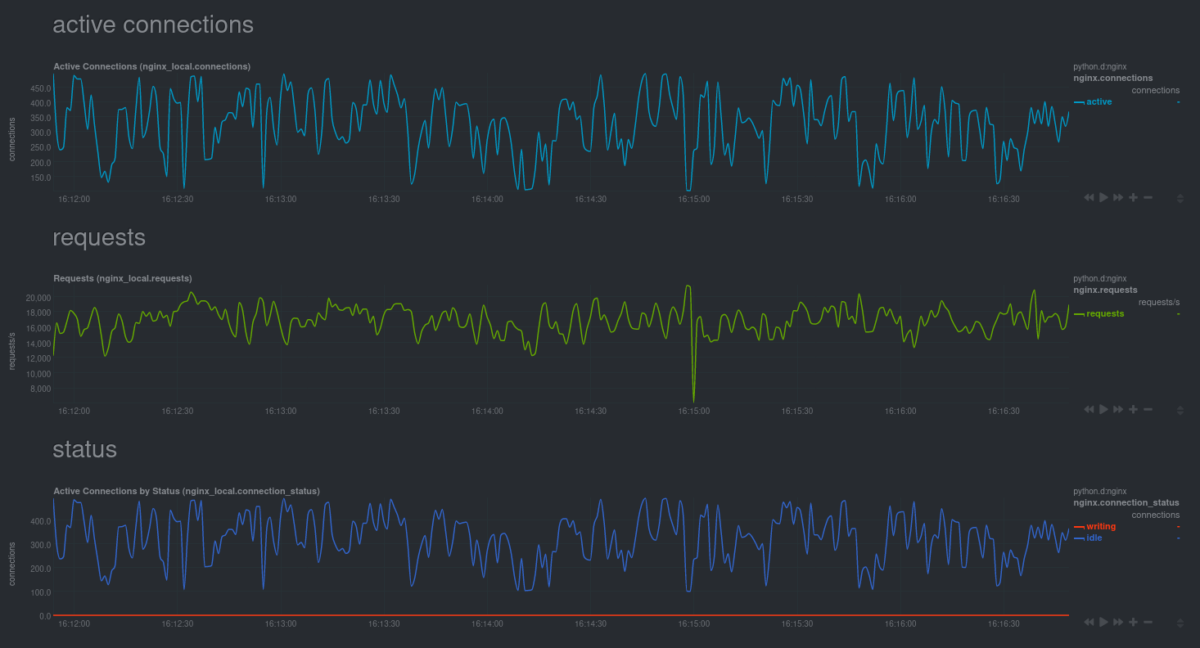
For example, here are some real-time charts for an Nginx web server, running inside of a Docker container, while it’s undergoing a stress test.
Visit our documentation and use the search bar at the top to figure out how to monitor favorite containerized service.
Get Started With Docker Monitoring In Netdata
To get started monitoring Docker containers with Netdata, install Netdata on any system running the Docker daemon. Netdata will auto-detect your cgroups and begin monitoring the health and performance of any running Docker containers.
If you already have Netdata installed and want to enable Docker monitoring, restart Netdata using the appropriate command for your system.
Netdata handles ephemeral Docker containers without complaint, so don’t worry about situations where you’re scaling up and down on any given system. As soon as a new container is running, Netdata dynamically attaches all the relevant alarms, and you can see new charts after refreshing the dashboard.
Learn more about Netdata’s Docker monitoring capabilities here.
Docker Container Monitoring: Frequently Asked Questions
Why Don’t I See My Docker Containers In Netdata?
Make sure the Netdata agent has permission to read from /sys/fs/cgroup/ and that containers are already running when Netdata starts. If not, restart Netdata after launching the containers.
Do I Need To Restart Netdata Every Time I Launch New Containers?
Only if automatic detection is disabled. By default, Netdata rescans for new containers periodically, but you can trigger an instant refresh with sudo service netdata restart.
Can I Set Custom Alarms For Specific Containers?
Yes. You can edit the health.d/cgroups.conf file to adjust thresholds or add new alarms for RAM, CPU, and more, on a per-container basis.
Does Netdata Support Monitoring In Kubernetes?
Yes. Netdata can be deployed as a DaemonSet to monitor all containers across your cluster. See our Kubernetes deployment guide for setup instructions.
Troubleshooting Docker Monitoring In Netdata
If Docker metrics are not appearing or alarms aren’t working as expected, review the following checks:
Verify Cgroup Access
Make sure the Netdata agent has permission to read from the /sys/fs/cgroup/ directory.
Check Container Timing
If your containers were started after Netdata, the agent may not detect them immediately. Restart Netdata to trigger detection.
Confirm Cgroup Version Compatibility
Netdata supports both cgroup v1 and v2, but misconfigured or unsupported kernel settings can interfere with monitoring. Confirm your system’s cgroup version.
Review Container Limits
On systems with many containers, default settings might not be sufficient. Consider adjusting Netdata’s resource limits or update frequency.
Inspect Alarm Configuration
Alarms may be disabled or have thresholds that are too high. Review the settings in the health.d configuration files to ensure alarms are active and calibrated to your environment.
If the issue persists, consult the official Netdata documentation or community support resources for more advanced troubleshooting.

