We recently got this great feedback from a dear user in our Discord:
I would really like to use Netdata to monitor custom internal metrics that come from SQL, not a fan of having 10 diff systems doing essentially the same thing as is, Netdata is pretty much all there in that regard, just needs a few extra features.
This is great and exactly what we want, a clear problem or improvement we could make to help make that users monitoring life a little easier.
This is also where the beauty of open source comes in and being able to build on the shoulders of giants - adding such a feature turned out to be pretty easy by just extending our existing Pandas collector to support SQL queries leveraging its read_sql() capabilities.
Here is the PR that was merged a few days later.
This blog post will cover an example of using the Pandas collector to monitor some custom SQL metrics from a WordPress MySQL database.
The set up
We will use the awesome-compose/wordpress-mysql example to stand up a local WordPress with a MySQL database. Then we will configure the Netdata Pandas collector to run some custom SQL queries against that database to measure some metrics around comment counts on posts.
This is really just a toy example to illustrate some sort of custom SQL metrics on semi-realistic data like a MySQL WordPress database, but you could easily apply a similar approach to any SQL database that can be read using pandas.read_sql().
In fact we hope to follow on this post with another one showing how we use this internally for custom business metrics (install success and fail counts, telemetry error events and things like that) that live in our BigQuery data lake.
We will start with a fresh Ubuntu 18.04 VM (GCP e2-medium) that has Netdata installed, claimed to Netdata Cloud and has Python and Docker already installed.
Our steps will be to:
- Install some pre-requisites to make
pandas.read_sql()work for MySQL. - Stand up the WordPress example.
- Configure the Netdata Pandas collector to run some custom SQL queries against the database.
- View the results in Netdata Cloud.
Installing pre-requisites
The first thing we need to do is install some pre-requisites to make pandas.read_sql() work for MySQL. This is because the pandas Python package does not include the MySQL driver by default. Under the hood pandas.read_sql() uses the SQLAlchemy package to connect to the database and execute the query. So we need to make sure the relevant driver is installed for the database we want to connect to.
In this example since we are querying a MySQL database we need to install the PyMySQL package along with Pandas and SQLAlchemy.
# install required python packages
sudo pip3 install pandas 'sqlalchemy<2.0' pymysql
Stand up WordPress
We will slighlty modify the example docker compose file to open the MySQL port to the host machine so we can connect to it from our Netdata collector. This is mainly just for convenience to keep this post simple.
# create folder for wordpress docker compose stuff
sudo mkdir /wordpress-mysql
cd /wordpress-mysql

# create docker-compose.yaml
sudo cat <<EOT > /wordpress-mysql/docker-compose.yaml
services:
  db:
    # We use a mariadb image which supports both amd64 & arm64 architecture
    image: mariadb:10.6.4-focal
    # If you really want to use MySQL, uncomment the following line
    #image: mysql:8.0.27
    command: '--default-authentication-plugin=mysql_native_password'
    volumes:
      - db_data:/var/lib/mysql
    restart: always
    environment:
      - MYSQL_ROOT_PASSWORD=somewordpress
      - MYSQL_DATABASE=wordpress
      - MYSQL_USER=wordpress
      - MYSQL_PASSWORD=wordpress
    expose:
      - 3306
      - 33060
    ports:
      - 3306:3306
  wordpress:
    image: wordpress:latest
    ports:
      - 80:80
    restart: always
    environment:
      - WORDPRESS_DB_HOST=db
      - WORDPRESS_DB_USER=wordpress
      - WORDPRESS_DB_PASSWORD=wordpress
      - WORDPRESS_DB_NAME=wordpress
volumes:
  db_data:
EOT

# start wordpress using docker compose
sudo docker compose up -d
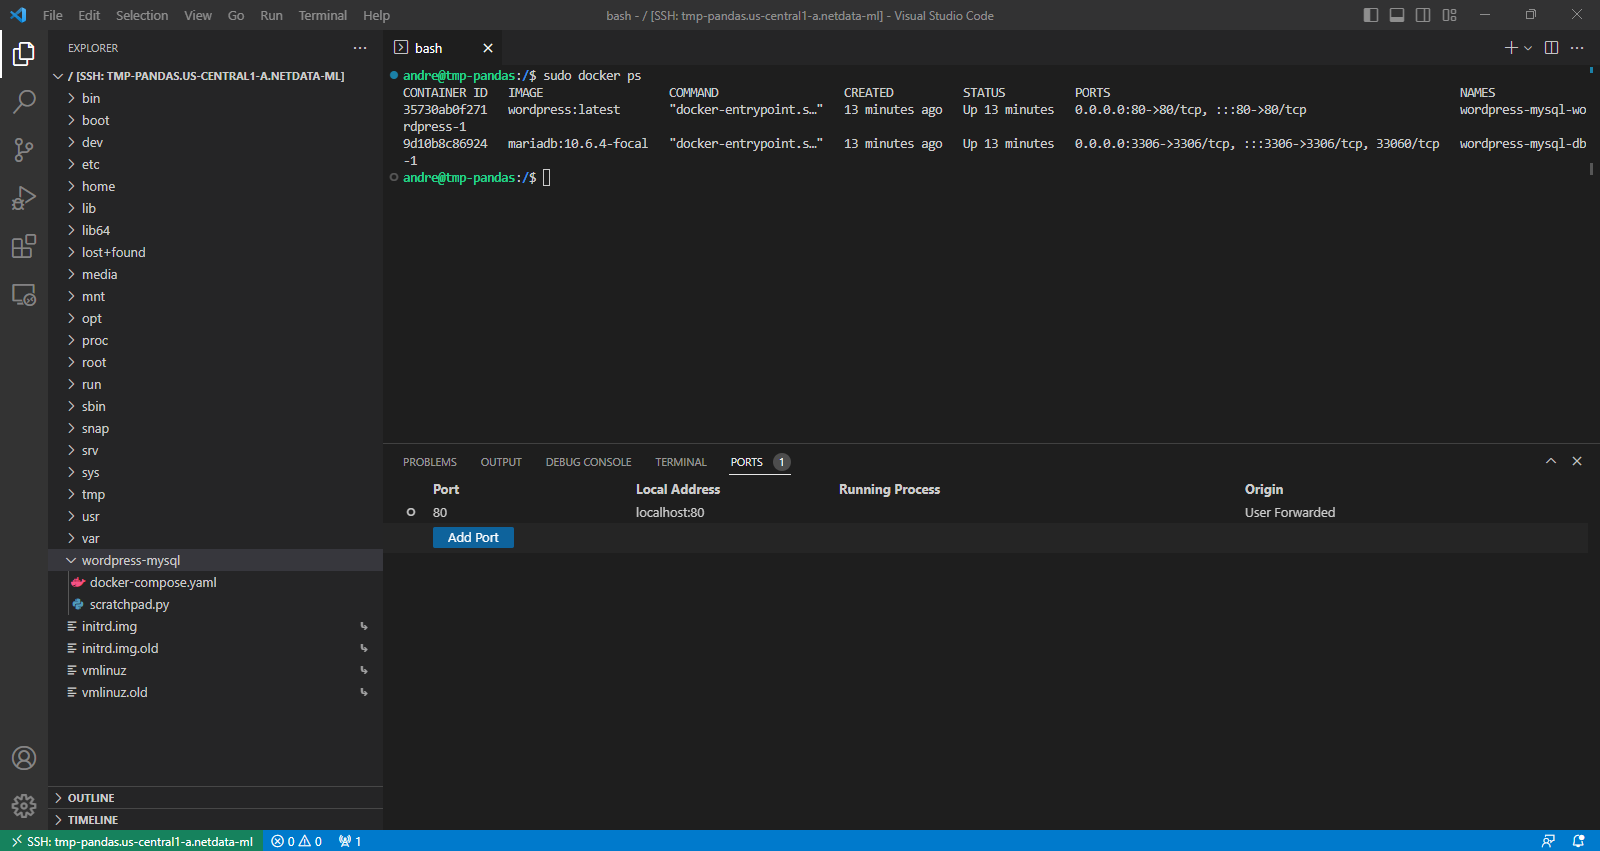
You should now have some WordPress containers running:
$ sudo docker ps
CONTAINER ID   IMAGE                  COMMAND                  CREATED          STATUS          PORTS                                                  NAMES
35730ab0f271   wordpress:latest       "docker-entrypoint.s…"   37 seconds ago   Up 34 seconds   0.0.0.0:80->80/tcp, :::80->80/tcp                      wordpress-mysql-wordpress-1
9d10b8c86924   mariadb:10.6.4-focal   "docker-entrypoint.s…"   37 seconds ago   Up 33 seconds   0.0.0.0:3306->3306/tcp, :::3306->3306/tcp, 33060/tcp   wordpress-mysql-db-1
Note: You will need to do one last manual step to actually complete the Wrordpress setup. You can do this by visiting port 80 on the host machine and following the prompts to complete the setup. One way to do this is by using gcloud compute config-ssh and VSCode remote SSH to connect to the VM and then visiting http://localhost:80 in your browser using port forwarding.
Once you navigate to http://localhost:80 you should see the WordPress setup page, complete the steps there to finish installation.
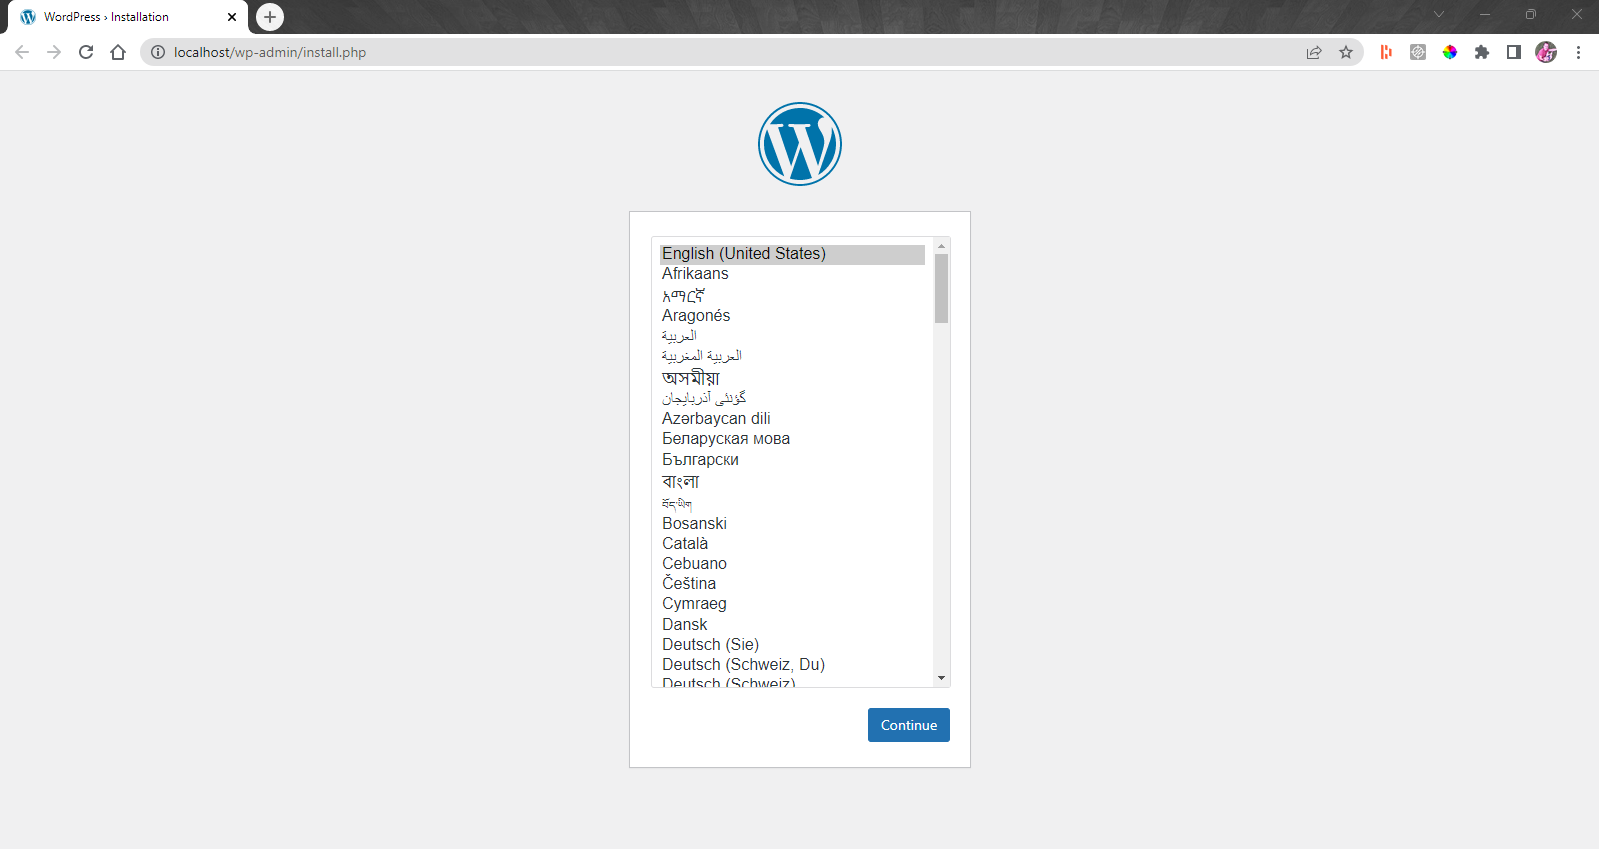
Once successful you should see a screen like this:
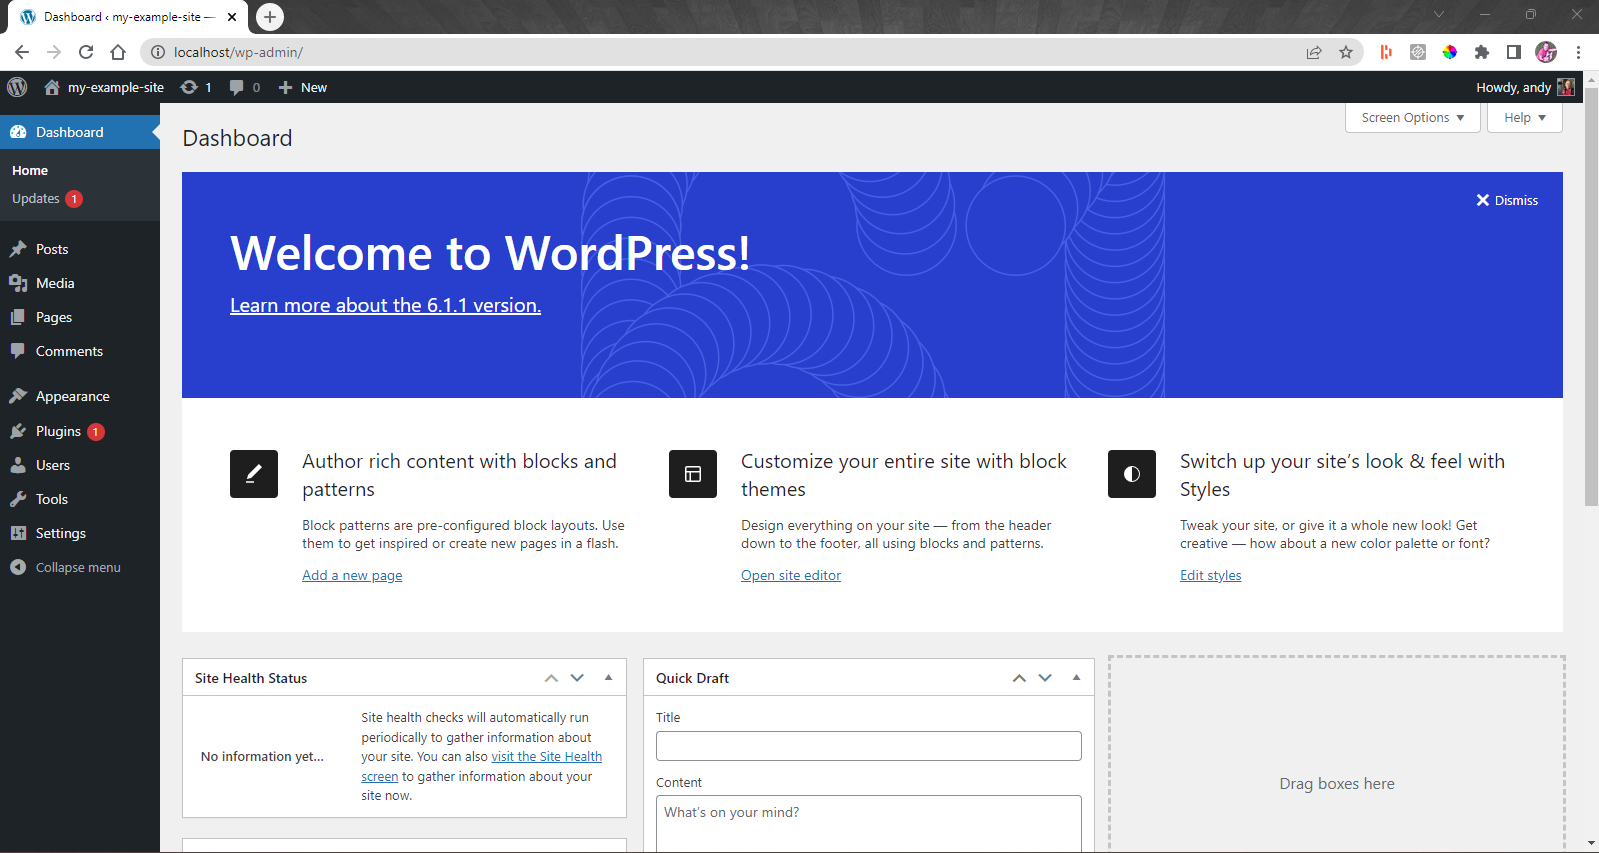
This means the database should now be running with some initial WordPress sample posts and comments.
Configure the Netdata Pandas collector
We need to enable and then configure the Netdata Pandas collector to run some custom SQL queries against the database.
# change directory to the netdata config directory
cd /etc/netdata

# enable the pandas collector
sudo ./edit-config python.d.conf
# set (uncomment) `# pandas: yes` to `pandas: yes` to enable the collector
Now we need to configure the collector to run our custom SQL queries. Usually there is a bit of iteration involved here to define the df_steps parameter. This is the series of Pandas commands that you want the collector to run.
So, for example, you might just want one step that is a pandas.read_sql() command to get the metrics you want (which is what we will do in this example).
If, however, you need or want to do further data wrangling with Pandas you can add additional steps to the df_steps parameter. You can read more about this in the Pandas collector documentation or this blog post that goes into much more detail and shows some more complex data wrangling examples.
It is usually helpful to make a little Python development script to iterate on your logic.
# navigate to folder we created above
cd /wordpress-mysql

# create scratchpad.py to iterate on SQL and Pandas logic
sudo cat <<EOT > /wordpress-mysql/scratchpad.py
# import required packages
from sqlalchemy import create_engine
import pandas as pd

# read data and define a series of Pandas commands to run
df = pd.read_sql("""
                 SELECT
                   -- define three metrics from the wp_comments table
                   count(distinct comment_ID) as comments,
                   count(distinct comment_author_email) as comment_authors,
                   count(distinct comment_parent) as comment_threads
                 FROM
                   wp_comments
                 """,
                 con=create_engine('mysql+pymysql://wordpress:wordpress@localhost:3306/wordpress')
                )
# end result should be a Pandas dataframe with one row and a column for each metric you want to send to Netdata
print(df)
EOT
Now if you run python3 /wordpress-mysql/scratchpad.py you should see the following output:
$ python3 /wordpress-mysql/scratchpad.py
   comments  comment_authors  comment_threads
0         1                1                1
This just shows the one example comment on the example post that WordPress comes with.
Once we are happy with our logic we can add it to the Netdata Pandas collector config in /etc/netdata/python.d/pandas.conf.
# navigate to netdata config directory
cd /etc/netdata

# edit the pandas collector config
sudo ./edit-config python.d/pandas.conf
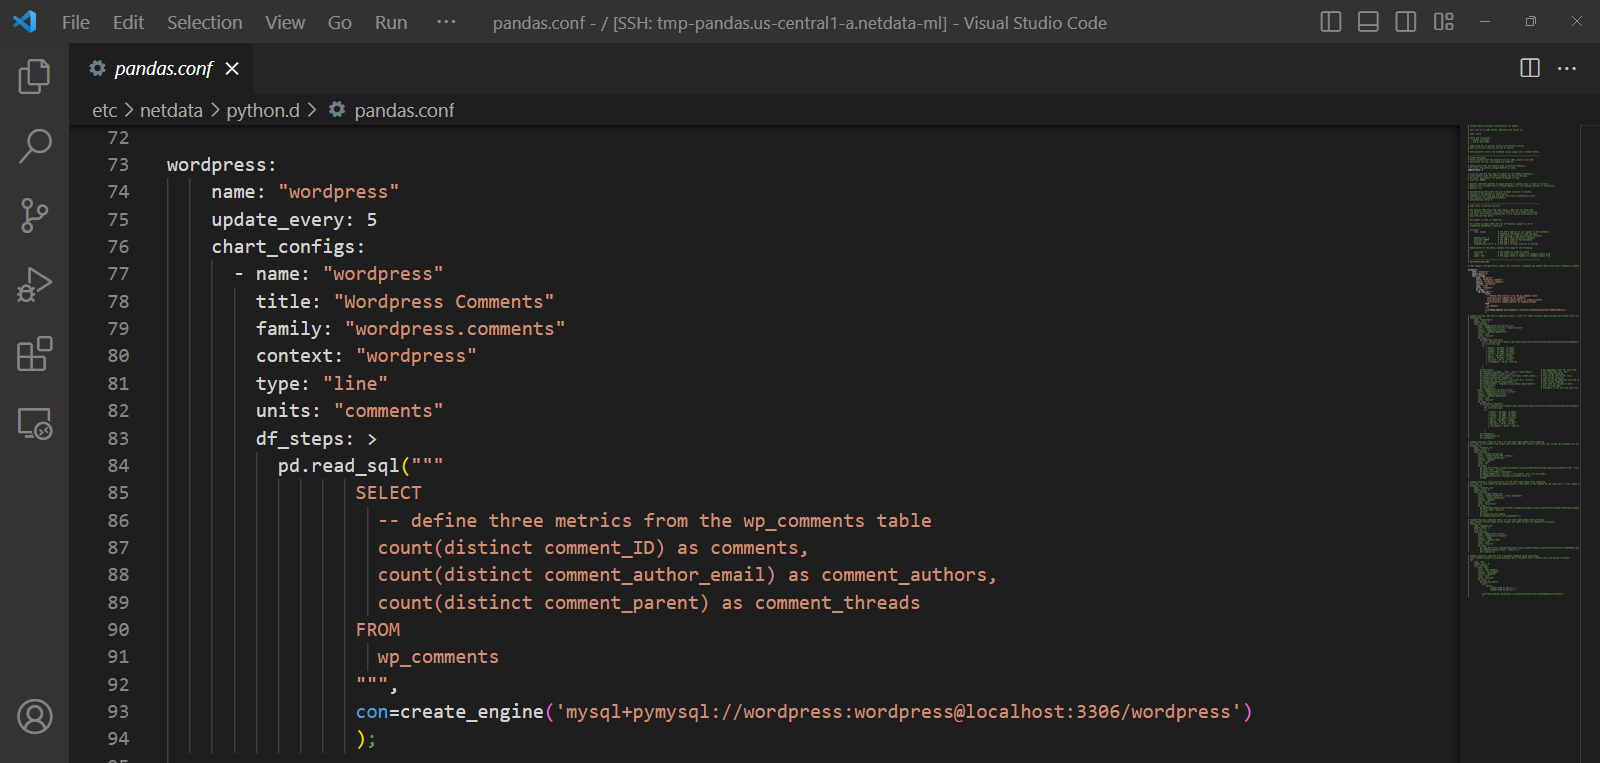
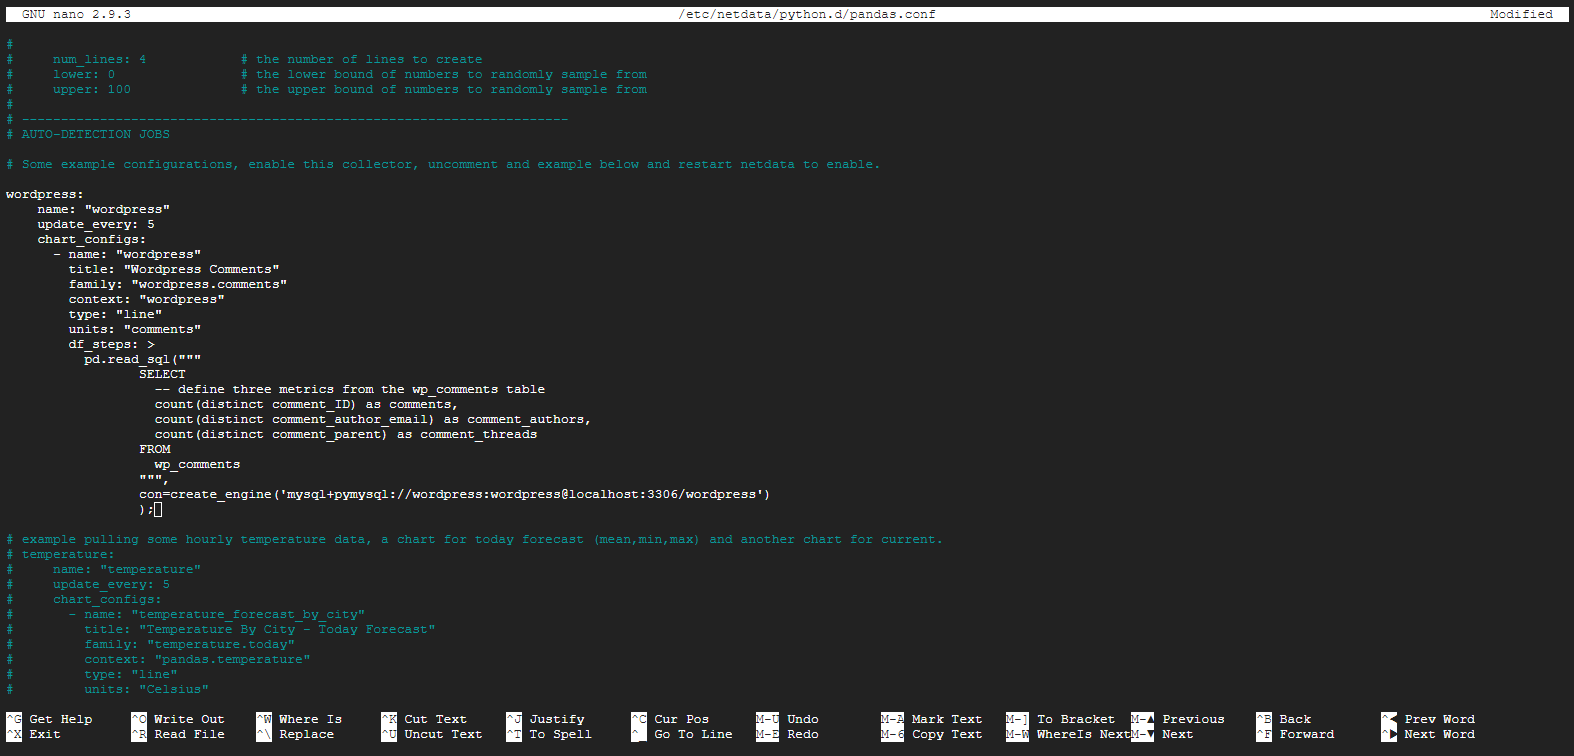
We will use a config like this in the jobs section of the pandas.conf file:
wordpress:
    name: "wordpress"
    update_every: 30
    chart_configs:
      - name: "wordpress"
        title: "WordPress Comments"
        family: "wordpress.comments"
        context: "wordpress"
        type: "line"
        units: "comments"
        df_steps: >
          pd.read_sql("""
                 SELECT
                   -- define three metrics from the wp_comments table
                   count(distinct comment_ID) as comments,
                   count(distinct comment_author_email) as comment_authors,
                   count(distinct comment_parent) as comment_threads
                 FROM
                   wp_comments
                 """,
                 con=create_engine('mysql+pymysql://wordpress:wordpress@localhost:3306/wordpress')
                 );
Here is a screenshot of how this might look.
To confirm the Pandas collector is working we can run it in debug mode:
# become the netdata user
sudo su -s /bin/bash netdata

# run pandas collector in debug mode
/usr/libexec/netdata/plugins.d/python.d.plugin pandas debug trace nolock
Successful output should look something like this:
$ /usr/libexec/netdata/plugins.d/python.d.plugin pandas debug trace nolock
2023-02-22 11:26:41: python.d INFO: plugin[main] : using python v3
2023-02-22 11:26:41: python.d DEBUG: plugin[main] : looking for '/etc/netdata/python.d.conf'
2023-02-22 11:26:41: python.d DEBUG: plugin[main] : '/etc/netdata/python.d.conf' is loaded
2023-02-22 11:26:41: python.d DEBUG: plugin[main] : looking for '/usr/lib/netdata/conf.d/python.d.conf'
2023-02-22 11:26:41: python.d DEBUG: plugin[main] : '/usr/lib/netdata/conf.d/python.d.conf' is loaded
2023-02-22 11:26:41: python.d DEBUG: plugin[main] : looking for 'pythond-jobs-statuses.json' in /var/lib/netdata
2023-02-22 11:26:41: python.d WARNING: plugin[main] : 'pythond-jobs-statuses.json' was not found
2023-02-22 11:26:42: python.d DEBUG: plugin[main] : [pandas] loaded module source : '/usr/libexec/netdata/python.d/pandas.chart.py'
2023-02-22 11:26:42: python.d DEBUG: plugin[main] : [pandas] looking for 'pandas.conf' in ['/etc/netdata/python.d', '/usr/lib/netdata/conf.d/python.d']
2023-02-22 11:26:42: python.d DEBUG: plugin[main] : [pandas] loading '/etc/netdata/python.d/pandas.conf'
2023-02-22 11:26:42: python.d DEBUG: plugin[main] : [pandas] '/etc/netdata/python.d/pandas.conf' is loaded
2023-02-22 11:26:42: python.d INFO: plugin[main] : [pandas] built 1 job(s) configs
2023-02-22 11:26:42: python.d INFO: plugin[main] : pandas[wordpress] : check success
CHART netdata.runtime_pandas_wordpress '' 'Execution time' 'ms' 'python.d' netdata.pythond_runtime line 145000 5 '' 'python.d.plugin' 'pandas'
CLABEL '_collect_job' 'wordpress' '1'
CLABEL_COMMIT
DIMENSION run_time 'run time' absolute 1 1

2023-02-22 11:26:42: python.d DEBUG: pandas[wordpress] : started, update frequency: 5
CHART pandas_wordpress.wordpress 'wordpress' 'WordPress Comments' 'comments' 'wordpress.comments' 'wordpress' line 60000 5 '' 'python.d.plugin' 'pandas'
CLABEL '_collect_job' 'wordpress' '0'
CLABEL_COMMIT
DIMENSION 'comments' 'comments' absolute 1 1 ' '
DIMENSION 'comment_authors' 'comment_authors' absolute 1 1 ' '
DIMENSION 'comment_threads' 'comment_threads' absolute 1 1 ' '

BEGIN pandas_wordpress.wordpress 0
SET 'comments' = 1
SET 'comment_authors' = 1
SET 'comment_threads' = 1
END
Finally we can restart Netdata and see the new chart in the dashboard.
# restart netdata
sudo systemctl restart netdata
Visualizing WordPress metrics in Netdata
Now you can go back to WordPress and create some dummy posts, comments and comment threads and watch as the metrics update in Netdata:
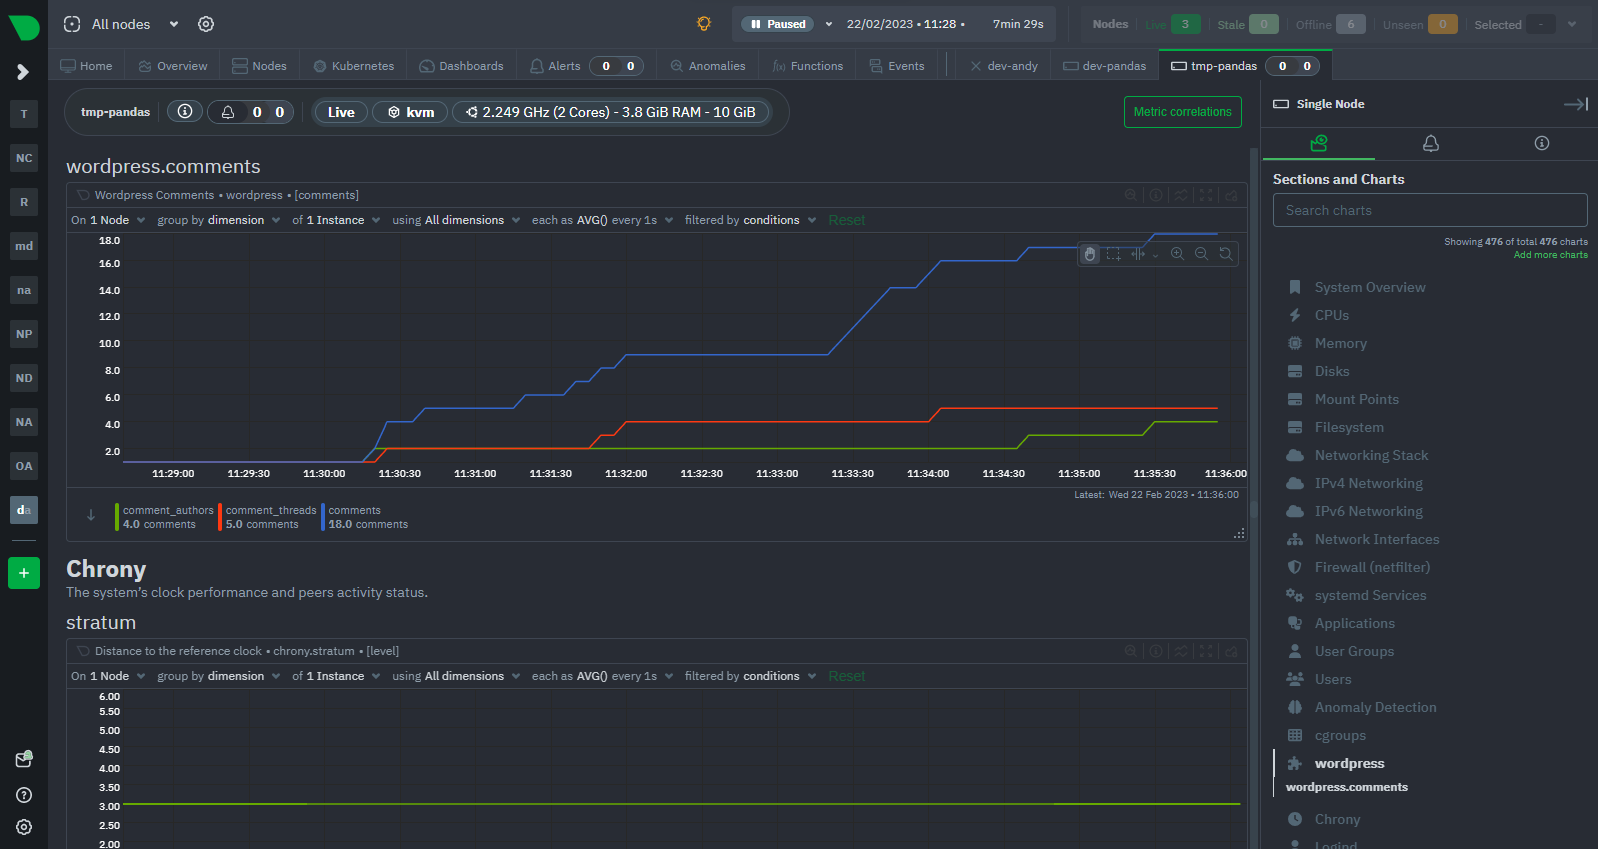
In this example we just made three counter type metrics comments, comment_threads and comment_authors but you can make any type of metric you want. You can also make multiple charts for each job. For example you could make a chart for each table in your database or different types of metrics of interest (there are some examples of this in the default pandas.conf).
Feedback!
If you have some custom metrics in a SQL database that you want to monitor in Netdata then please feel free to try this out and let us know how it goes. We would love to hear your feedback and see what you come up with.
If you have ideas or requests for other features that you’d like to see on Netdata, you can create a GitHub Discussion, open a Feature request on our Netdata Cloud repository or engage with the community on the Netdata Discord, community forums or just drop a comment on in the giscus below this post!


