Take the out-of-the-box monitoring power of the Netdata Agent.
And multiply across your entire infrastructure with Netdata Cloud.
Aggregated dashboard with preconfigured composite charts
See every real-time chart and metric you need to understand the status of your infrastructure. And with zero configuration, composite charts visualize metrics from every node assigned to a War Room, or a configurable subset.
Distributed architecture, privacy by design
Netdata Cloud’s distributed data architecture is so fast and efficient, there’s no limit to the number of metrics you can follow. And with metrics live-streamed to your dashboard, we don’t collect data centrally, ensuring complete data privacy.
Zero-config Kubernetes collection and visualization
Just connect the Netdata Agent to your Kubernetes cluster with our Helm chart, and it automatically spins up the appropriate number of pods and collects an unlimited number of metrics from the node itself, kubelet/kube-proxy, and any containerized services/applications such as databases and web servers. Learn more.
Troubleshoot with opinionated alerts before incidents cost money
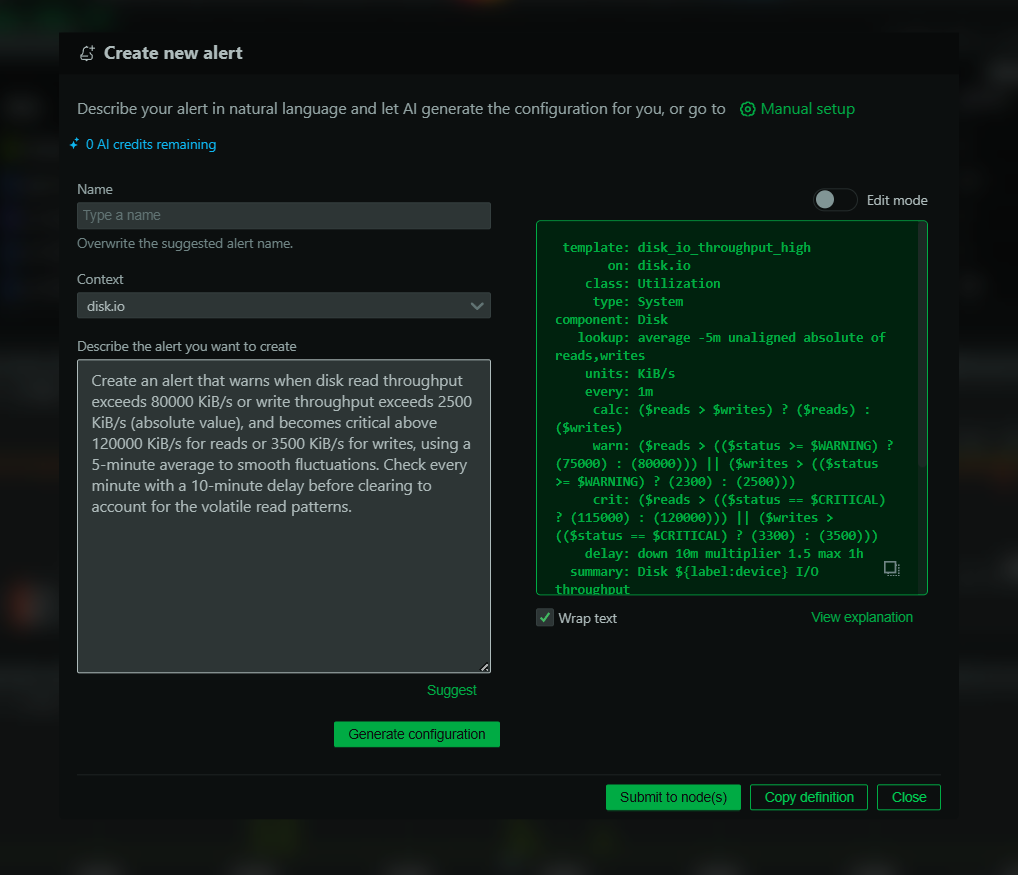
Pre-configured (and tweakable) performance thresholds send automated warnings from any affected node. Your Alerts Panel lists all active alerts, what charts are affected, their current values, and when the anomaly began—to help you and your team drive down response times.
Intelligence-assisted anomaly detection, alerts and correlations
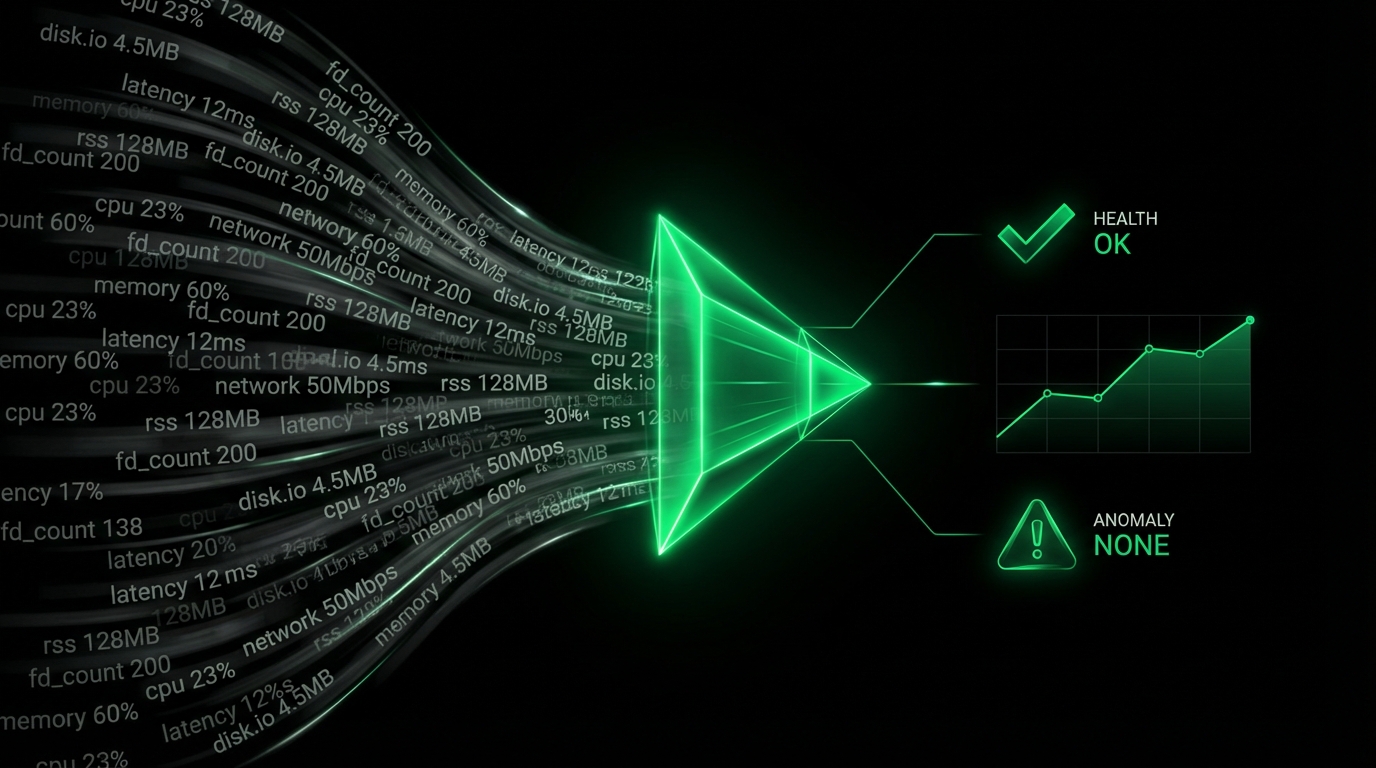
Our pioneering ML learns what’s “normal” so it can instantly detect and alert you to an emerging anomaly. Then our Metric Correlations feature can scan every other metric to show you any related anomalies within the same time frame. In your face, anomalies.
Team-based troubleshooting with Spaces and War Rooms
Allocate nodes to Spaces, where separate teams can focus on different parts of your infrastructure. Respond to alerts in tactical War Rooms, organized by service, location, purpose or incident, and troubleshoot at speed.
Navigate to any node remotely
Our Nodes View gives you a single view into every node running Netdata Agent. See and customize key metrics and seamlessly navigate to any node’s dashboard for granular performance troubleshooting.
Customize dashboards to your performance targets
It’s easy to build new dashboards that target your infrastructure’s unique needs. Put key metrics from any number of distributed systems in one place for a fully interactive, real-time, bird’s eye view of your most important charts. Learn how.
Prevent infrastructure crises. Without ownership headaches.
Migrate with confidenceJust sign in, free, point our self-configuring magic at your individual nodes, and watch your dashboard take shape. Allocate nodes and team members to Spaces and War Rooms—and go. See the whole process in 90 seconds. | Automate your node connectionComplex infrastructure? You don’t need to connect each node individually—simply use an automation tool like Ansible. Full instructions here. | Shortest time to valueSlash time-to-value from weeks to as little as hours. With auto-integration, self-configuration, team-based troubleshooting, and automated anomaly notifications and correlations. | Lowest cost of ownershipAll current functionality permanently free. No extra computing resources or dedicated expertise required. Auto-updates. An engaged, supportive community. Ready? |